Cryptography Reference
In-Depth Information
Figure 15.1: Three lines of printed text scanned in at 400 pixels per
inch.
300000
275000
250000
225000
200000
175000
150000
25
50
75
100
125
150
175
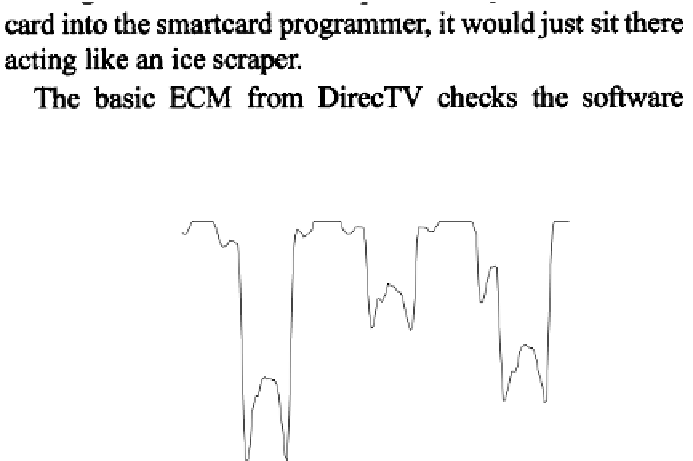
Figure 15.2: A graph of the sums of the rows in Figure 15.1. White
is usually assigned 255, so the short line in the middle is less pro-
nounced.
in each row. Figure 15.2 shows the result of summing the intensity
of each pixel in the row. The maximum value of each pixel is 255
if it is completely white. For this reason, the second row has a much
smaller valley because it is shorter andmade up of more white space.
The structure of the peaks and valleys also varies with the words.
The third rowhas more capital letters, so there is a more pronounced
valley at the beginning corresponding to the horizontal lines in the
capital letters. The choice of the font also changes the shape of this
graph and can even be used to identify the font. [WH94] Generally,
fonts with serifs make it easier to identify the baselines than sans-
serif fonts, but this is not guaranteed.
More bits can be packed into each line by shifting individual
words up or down a three hundredth of an inch. The detection pro-
cess becomes more complicated because there is less information to
use to measure the horizontal shift of the baseline. Short words are
not as desireable as longer ones. In practice, it may make sense to
group multiple small words together and shift them in a block.
Experiments by Jack Brassil and Larry O'Gorman show that the lo-
cation of the baseline and any information encoded in it can be reg-
ularly extracted from text images even after repeated photocopying.