Biomedical Engineering Reference
In-Depth Information
different concentrations were suspended in 10 mL of 0.9% NaCl solution and incubated
for 1 h at 37°C in a shaking water bath. Diluted blood (0.2 mL) was added into micro-
sphere suspensions and incubated for 1 h. The release of hemoglobin was determined
after centrifugation (700
g
for 10 min) by photometric analysis of the supernatant at
545 nm. Positive and negative controls were produced by adding 0.2 mL of diluted
blood to 10 mL of distilled water and saline water. Percentage hemolysis was calculated
as follows:
AS
−
−
AN
Hemolysis(%)
=
× 100
AP
AN
where AS, AP, and AN are the absorbencies of sample, positive control, and negative con-
trol. Less than 10% hemolysis was regarded as the nontoxic effect level.
3.2.1.6 Sodium Dodecyl Sulfate-Polyacrylamide Gel Electrophoresis
Sodium dodecyl sulfate-polyacrylamide gel electrophoresis (SDS-PAGE) was performed
on vertical slab gels (18 × 13 × 0.1 cm
3
). Resolving and stacking gel conditions were 8% and
5% acrylamine, respectively. Protein extract samples were mixed in a 1:1 ratio with sample
buffer and heated at 100°C for 5 min; then 20 mL of protein-buffer solution was applied to
the gel. The protein was visualized by staining with Coomassie Brilliant Blue R-250. MWs
were estimated using the linear relationship between the lag of the MW of the standards
and relative mobility.
3.2.1.7 Hemolytic Properties
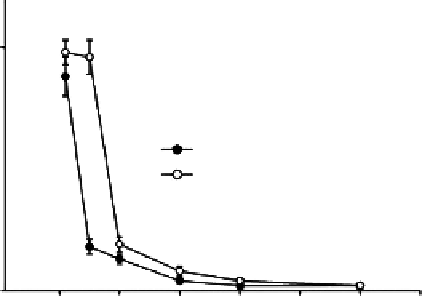
Figure 3.1 shows the dynamic blood clotting profiles for chitosan microspheres. The absor-
bance of the hemolyzed hemoglobin solution varied with time. Chitosan microspheres
showed a rapid decrease of BCI at 5 min, while the control exhibited the same phenome-
non at 10 min. The time at which absorbance equals 0.01 was generally defined as the
clotting time, and the slower the decrease of BCI value with time, the longer the clotting
1
Chitosan microspheres
Control
0
0
10
20 30
Time (min)
40
50
60
Figure 3.1
BCI of chitosan microspheres.
Search WWH ::

Custom Search