Biomedical Engineering Reference
In-Depth Information
map (r) with which the correction factors can then easily be calculated. In
the following sections, several approaches that have been applied in PET and
SPECT systems are discussed. Although attenuation in emission tomography
is a well-understood phenomenon, these correction approaches themselves may
introduce new problems leading to image degradation and biased quantifica-
tion requiring strategies to minimize these problems. This is subject of current
research and shall be discussed in yet another section.
Besides these methods that are based on a measurement of transmission
data, several methods based on calculating attenuation correction factors have
been investigated [92]. However, as these are usually restricted to certain ap-
plications in emission tomography, they are not discussed here.
Recent development of hybrid PET/MR systems has led to new challenges
in the field of attenuation correction which will be discussed in detail later in
this topic.
5.4.1 Stand-alone emission tomography systems
In stand-alone PET systems, attenuation correction factors are usually
determined by performing an extra transmission scan besides the ordinary
emission scan. For this approach, one or more positron-emitting sources, either
in ring form or as rod sources [19], located inside the detector ring rotate
around the scanned object; see Figure 5.7. These sources usually contain a few
mCi of
68
Ge which decays into the positron emitter
68
Ga with a half-life of 271
days. In order to avoid excessive dead time when using just one rod source [31],
two or three rod sources with accordingly reduced activity are usually used,
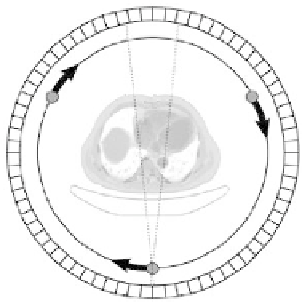
FIGURE 5.7: Transmission scan using three rod sources rotating around
the patient. When using sinogram windowing, only coincidence events that
pass through one of the sources (for example the dashed lines) are taken
into account, therefore reducing the bias introduced by random and scattered
events.


Search WWH ::

Custom Search