Biomedical Engineering Reference
In-Depth Information
As can be seen from Equation 5.13, the main task in correcting PET data
for attenuation is either the direct determination of the attenuation correc-
tion factors for each line of response or the computation of the attenuation
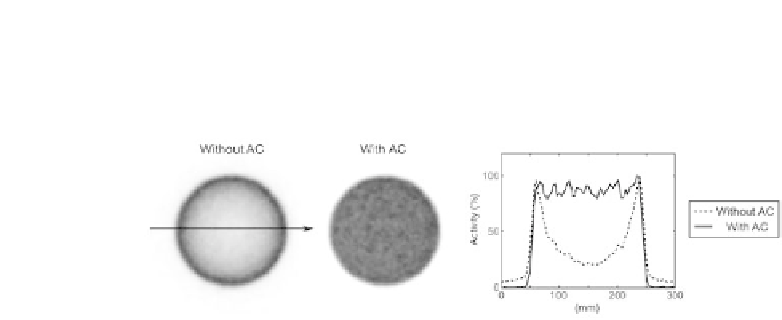
FIGURE 5.5: PET image of a homogeneously-filled cylinder phantom con-
taining
68
Ge. The activity in the center is severely underestimated in the non-
attenuation-corrected image (left) as compared to the properly attenuation-
and scatter-corrected image (middle) as demonstrated by the profile along the
indicated arrow (right).
FIGURE 5.6: FDG PET scan of the thorax showing non-attenuation cor-
rected (top) and attenuation-corrected image (bottom) along with the atten-
uation map (r). Without correction, structures like liver and heart interiors
are suppressed in terms of tracer uptake, while uptake in tissue with small
values, like the lungs, is over accentuated.


Search WWH ::

Custom Search