Biomedical Engineering Reference
In-Depth Information
FIGURE12.7: Combined FMT and MRI imaging. Examples of fluorescence
imaging using a cathepsin B-activatable imaging probe. (a) and (b), Enzyme
activity in a 9L glioma model in a live mouse. The image in (a) is superimposed
onto an MRI image shown separately in (b) with gadolinium enhancement of
the glioma28. (c), In vitro FRI of the axial brain section corresponding to the
MR and FMT images. The tumor position is indicated by the arrow. (From
[29].)
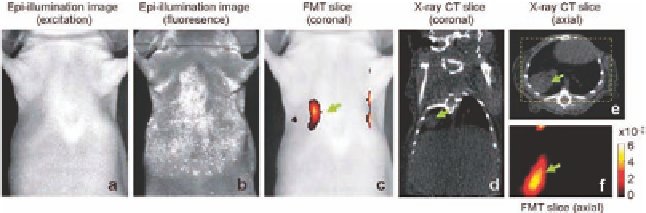
FIGURE12.8: Tomographic imaging of fluorescent proteins and correspond-
ing X-ray CT from a nude mouse implanted with GFP-expressing lung tumors,
obtained 10 days post-image implantation. (a) Epi-illumination image of the
mouse at the excitation wavelength; (b) Epi-illumination image at the emis-
sion wavelength showing high skin autofluorescence. (c) Tomographic slice (in
color, after threshold was applied) obtained from the tumor depth (7 mm
from top surface) overlaid on the white light image of the mouse. (d, e) CT
coronal and axial slices, respectively; the tumor position is marked by arrows.
(f) Axially reconstructed slice corresponding to the yellow dashed rectangle
on (e). (From [31].)


Search WWH ::

Custom Search