Biomedical Engineering Reference
In-Depth Information
was at the level of the pancreas with limited respiratory motion extend of ap-
proximately 1cm and of limited non-rigid nature. Lamare et al. have proposed
a methodology based on the incorporation during a list mode-based iterative
reconstruction algorithm of a B-splines model allowing taking into account
both the displacement of the voxels, and their shape deformation at the same
time [30] (different implementations of the non-rigid transformation during the
iterative reconstruction algorithm are compared in this paper, which could be
of interest for some readers). They have demonstrated that the application of
an elastic spatio-temporal transformation during the reconstruction process of
gated PET datasets leads to significant improvements in overall image quali-
tative and quantitative accuracy, making use of all available data throughout
a respiratory gated acquisition. In addition, their results demonstrate that the
application of the spatial transformation in the raw data domain within the
reconstruction leads to superior contrast (on average between 20% and 30%
higher) in comparison to simply adding together already reconstructed and
realigned images of the individual gated frames.
Numerous authors have previously suggested the use of 4D CT datasets
to derive transformation maps subsequently used to correct for respiratory
motion [35, 44, 29, 30]. Nevertheless, in a 4D PET/CT acquisition, in addition
to the 4D CT images, the gated PET images are also available during a
dynamic PET acquisition, and can also be used to compute the elastic motion
correction parameters. Lamare et al. [31] carried out a study in order to assess
the effect in terms of motion compensation in the final motion corrected image
reconstructed using their motion correction integrated reconstruction [30] in
combination with the transformation parameters derived from these three
different dynamic image series: the 4D CT images and the gated PET images
reconstructed with and without attenuation correction. The transformation
parameters calculated from these three different sets of images may vary and as
a result produce, after the reconstruction, images with different performances
in terms of respiratory motion compensation. As can be seen in Figure 9.5, a
mismatch between the dynamic CT images and the PET emission data may
(a)
(b)
(c)
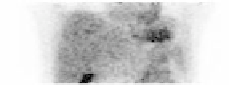
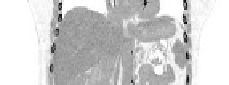
FIGURE 9.5: (See color insert.) Representation of one temporal bin of
the acquisition gated with the respiration: (a) gated PET image non corrected
for attenuation, (b) gated CT image, (c) overlaid image of both PET and CT
gated images. A misalignment of 6/7mm between the PET and CT images
can be seen at the level of the diaphragm on the overlaid image inside the
yellow circle.


Search WWH ::

Custom Search