Biomedical Engineering Reference
In-Depth Information
a
Zero Reference
20
10
0
−
10
10
12
0
2
4
6
8
Time (
s)
µ
b
Human Sample No.34 Dir B in immersion
0.5
0
−
0.5
0
2
4
6
8
10
12
Time (
µ
s)
c
Human Sample No.34 Dir B saturated with Air
0.2
0
−
0.2
0
2
4
6
8
10
12
Time (
µ
s)
d
Water Reference for the sample No.34 Dir B
20
10
0
−
10
0
2
4
6
8
10
12
Time (
µ
s)
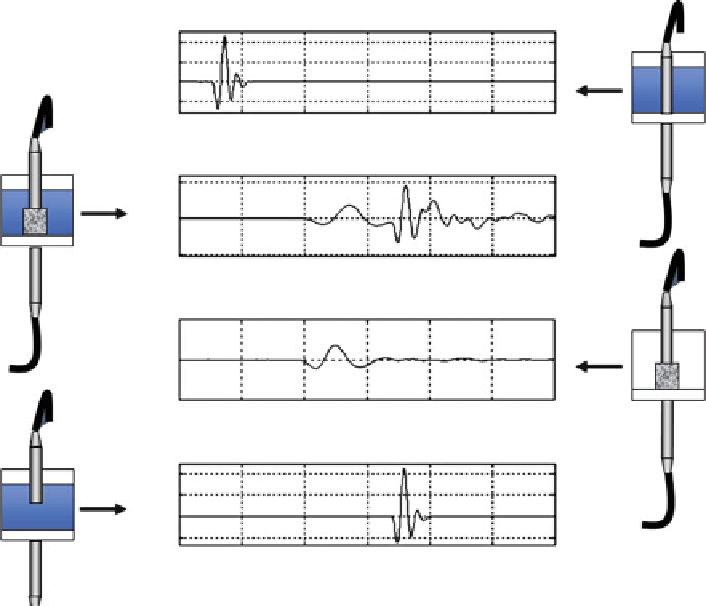
Fig. 9.4
Each panel of this four-panel figure contains a plot of amplitude vs. time for a wave
passing thought different media. In panels 1 and 4 the media is water, but the placement of the
emitting and receiving transducers is different. In panel 2 there is a fluid saturated porous
specimen and in panel 3 there is the porous specimen but no water. These various combinations
of test media and transducer setups are illustrated in the small cartoons to the left or right of each
plot of amplitude vs. time. In each cartoon the emitting and receiving transducers are indicated
as tubes (bottom and top of the cartoon) applied to the specimen in the water or air filled
container. In panel 1 the signal detected corresponds to the wave at the bottom of the measure-
ment cell. This is the ultrasound wave that would excite the porous media under the conditions
shown in panels 2 and 3. In panel 2 the shape of the wave is determined by its passage through a
fluid saturated porous specimen between transducers. In panel 3 there is no water, just the porous
specimen, so the shape of the wave is determined by its passage through the unsaturated porous
specimen between transducers. Panel 4 is the same as panel 1 except the space between the
transducers is the same as if the specimen were there. Notice that, in this case, the shape of
the wave is the same as in panel 1 but it is displaced to a greater time. It is only in panel 2 that the
waveform shape is determined by the passage through the saturated porous specimen and
one can see that the first part of the waveform is similar to that of the wave propagating in the
unsaturated porous medium and the last part of the waveform is similar to that of the wave
propagating in the fluid. Therefore, the waveform in panel 2 is shown to be composed by two
waves; the first wave is identified as the fast wave of poroelastic wave propagation theory
(shorter arrival time), and the second wave is the slow wave (larger arrival time). In this
example, the propagation of the fast wave is closely related to the solid phase of the medium,
while the slow wave is mostly related to the fluid saturating the pores
Search WWH ::

Custom Search