Biomedical Engineering Reference
In-Depth Information
all dumbbell-shaped C-C bonds being visible in the sheet when an
iso-surface is applied at the value of the electronic charge density
associated with a (calibrated) sp
2
bond.
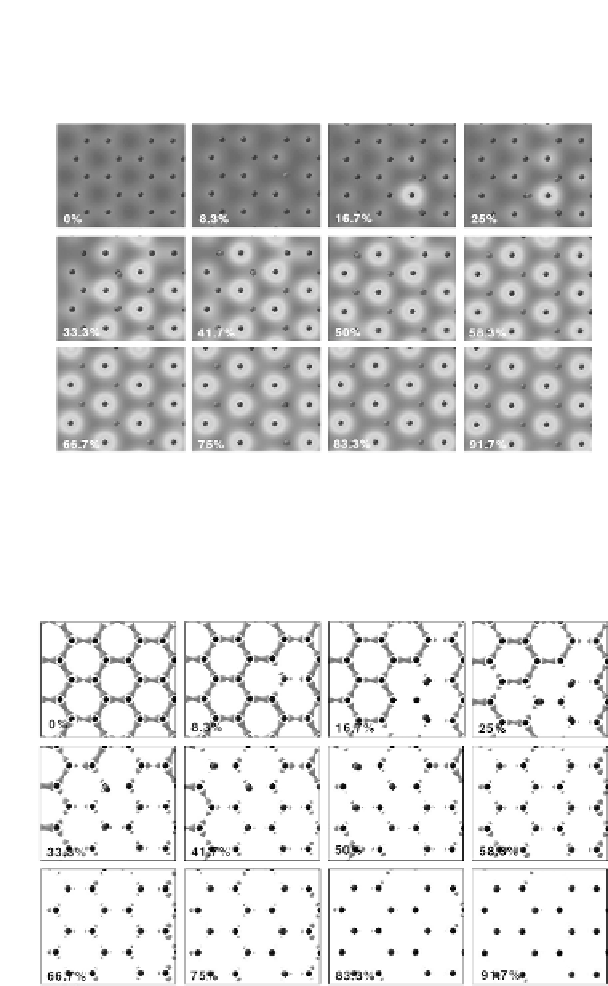
Figure 7.3
The ECD in the plane between the upper graphene layer and the
diamond surface below, for sequential adsorption of H atoms
(percentage of surface hydrogenation indicated in lower left
corner). The increasing ECD in this region is entirely due to
newly formed interlayer bonds. Reproduced with permission
from Ref. [12]. Copyright American Scientific Publishing, 2005.
Figure 7.4
The sp
2
iso-surface in the plane of the graphene upper layer,
for sequential adsorption of hydrogen (percentage of surface
hydrogenation indicated in lower left corner). Images sequence
runs left to right, top to bottom. Reproduced with permission
from Ref. [12]. Copyright American Scientific Publishing,
2005.