Biomedical Engineering Reference
In-Depth Information
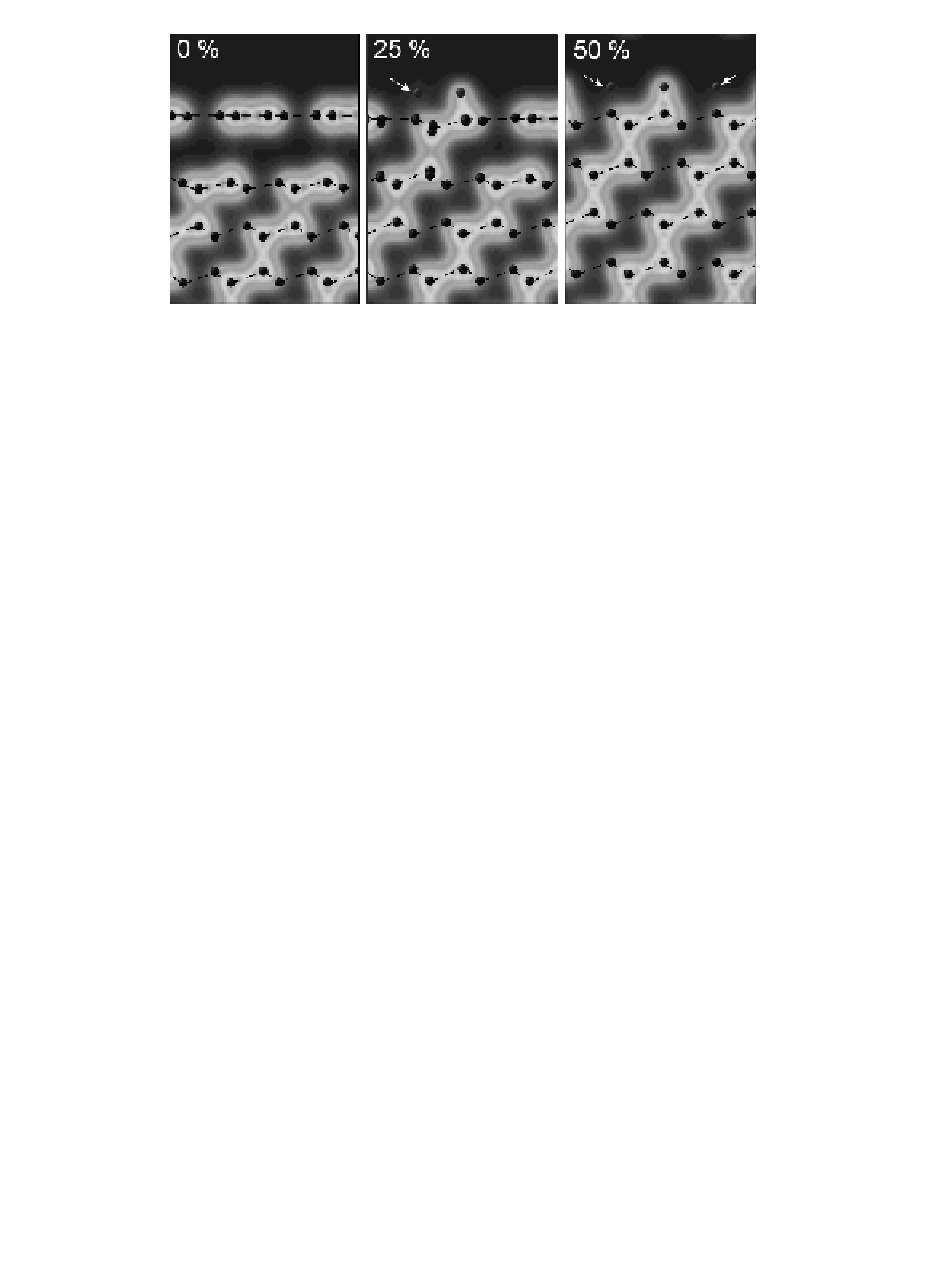
Figure 7.2
The ECD in a (110) plane perpendicular to the diamond
surface, for 0%, 25%, and 50% surface hydrogenation (left
to right). The dashed lines are to guide eyes along the (111)
atomic bilayers. H atom marked with arrow are out or the plane
of the ECD but attached to the carbon atom beneath, hence the
C-H bond is not visible from this perspective. Reproduced
with permission from Ref. [12]. Copyright American Scientific
Publishing, 2005.
Using this technique, the first step is to establish the ECD for
known sp
2
3
bonds [20]. This calibration can be done using
hydrocarbon molecules ethane and ethylene, respectively. Figure 7.1
gives the two-dimensional charge density profiles (to the left) for
these hydrocarbons, in the plane of the C-C bonds. The value of the
charge density in the center of the C-C bond in each molecule was
determined and scaled by the maximum charge density to obtain
values corresponding to sp
or sp
3
for the sp
2
bond hybridization.
3
For sp
hybridization, the dimensionless, fractional value of the
charge density in the center of the C-C bond in ethane was found to be
~0.68. In the case of ethylene, the same procedure gave a fractional
value of ~0.93 for the sp
2
bond. Using these values constant charge
iso-surfaces may be created to highlight sp
bonds. The images in
the center of Fig. 7.1 show the iso-surfaces for ethane (top) and
ethylene (bottom) corresponding to 68% of the maximum value. In
these cases, all bonds present in the structures are shown, including
the C-H bonds. However, when applying a sp
2
2
iso-surface
corresponding to 93% of the maximum value, a dumbbell-shaped
bond between the carbon atoms is shown in the case of ethylene,
but not in the case of ethane (right of Fig. 7.1). Therefore, generating
a constant charge iso-surface corresponding to approximately