Biomedical Engineering Reference
In-Depth Information
adsorption was
determined by the standard BET analysis, and the D
-
R model was
used to determine micropore information [26, 30] and the density
functional theory (DFT) approach was used to analyze the micropore
volume and pore size distribution (PSD) [50]. The calculated
micropore volume and the micropore radius of gyration are found
in Table 3.4.
The specific surface area obtained via N
2
Table 3.4
The porous structure properties determined by nitrogen
adsorption, mass loss, and hydrogen uptake capacity for the
samples [49]
b
V
meso
(cm
3
/g�
(cm
3
/g�
V
mic
S
BET
(cm
2
/gg�
R
Gmic
(nm�
H
2
wt.%
Sample
CAC
680 ± 11 0.62 ± 0.01 0.39 ± 0.01 0.34 ± 0.01 2.2
CAC-A900 1403 ± 21 0.67 ± 0.02 0.58 ± 0.01 0.52 ± 0.01 3.1
CAC-A1000 2796 ± 26 0.94 ± 0.04 1.33 ± 0.02 1.06 ± 0.02 5.2
CA-A900 1280 ± 13 0.61 ± 0.02 0.50 ± 0.01 0.45 ± 0.01 2.9
CA-A1000 2139 ± 20 0.78 ± 0.03 0.81 ± 0.01 0.75 ± 0.01 4.2
a
Note:
S
: BET surface area;
R
: average micropore radius of gyration and
V
: the total micro-
BET
Gmic
mic
b
pore volume as calculated by the D-R model through Eqs. (3.5) and (3.6);
V
: the total micropore
mic
volume as calculated by the DFT method.
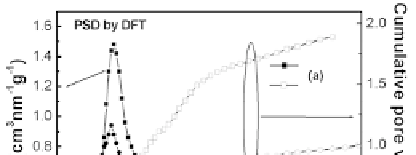
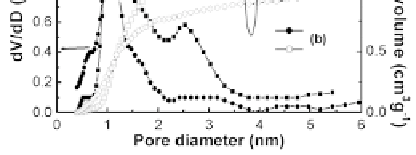
The corresponding PSDs are shown in Fig. 3.9.
Figure 3.9
DFT-PSD (d
) vs. pore diameter and cumulative pore
volume corresponding to sample CAC-A1000 (a) and sample
CA-A1000 (b) [49].
V
/d
D