Biomedical Engineering Reference
In-Depth Information
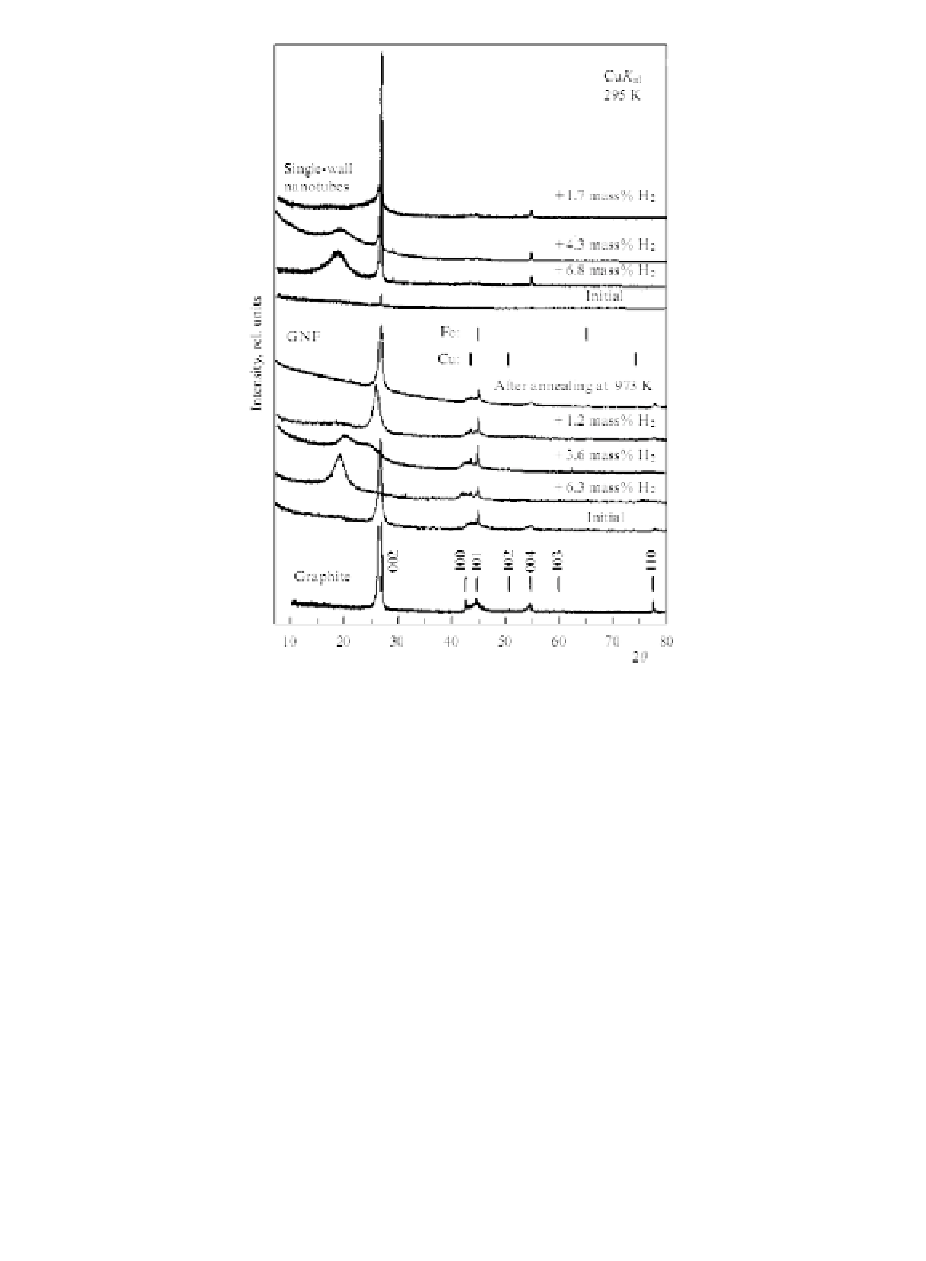
Figure 2.18
X-ray diffraction patterns of GNF and single-wall nanotube
samples at
room temperature in the initial state after
hydrogen saturation at 9 GPa (6.8 and 6.1
wt%
H
), after
removal of about 40% of the adsorbate (4.3 and 3.6
wt%
H
2
)
after degassing annealing to 873-923 K (1.7 and 1.2
wt%
H
2
) and after prolonged annealing at 973 K (GNF). The MPG-
6 graphite diffraction pattern is presented for comparison.
The dashed diagrams for Fe and Cu indicate the presence of a
catalyst impurity in GNF (from
Ref
. [94]).
2
This implies that ≤37% (for single-wall nanotube samples) and
≤43% (for GNF samples) of the total content of the adsorbed hydrogen
is characterized by IR adsorption lines typical for C-H bond valence
vibrations and correspond to process
. It can be also assumed that
≥60% of the total content of the adsorbed hydrogen corresponds to
process
β
γ
, characterized by the absence in the IR spectra of vibrational