Information Technology Reference
In-Depth Information
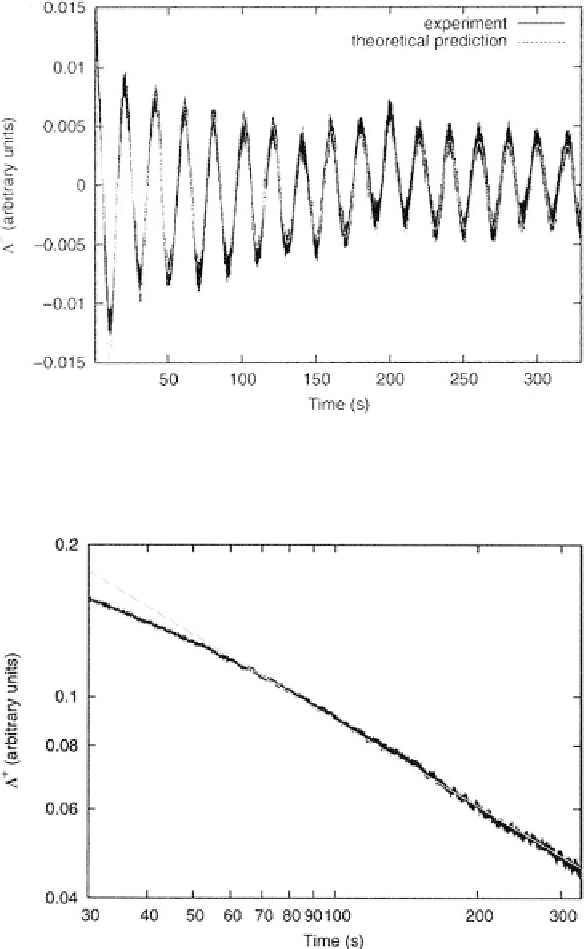
Figure 7.7.
The dots are the experimental results [
5
] expressed as the difference variable
D
(
t
)
as a function
of time. The theoretical prediction of (
7.140
) and the experimental data cannot be distinguished
from one another. Redrawn with permission.
The wiggly curve is given by the sum variable
S
(
t
)
as a function of time. The straight-line
segment is the best inverse power-law fit to the experimental data [
5
]. Redrawn with permission.
Figure 7.8.
leads to a definition of
that is more accurate than that determined in earlier work
[
62
]. Thus, the excellent agreement between the fitting formula of (
7.140
) and the
experimental results of Figure
7.7
requires only two fitting parameters,
μ
and
C
.
The authors of [
5
] afford compelling evidence that the response of the web is rig-
orously proportional to the perturbation intensity, as it should be if a proper LRT
is applicable. To complete the experimental proof of the non-stationary LRT, they
φ

