Information Technology Reference
In-Depth Information
4
3
2
1
0
-1
-2
-3
2.5
3
3.5 4 4.5
Log Income in Dollars
5
5.5
6
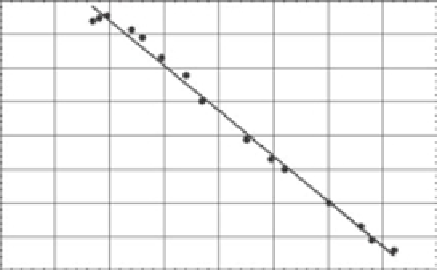
Figure 1.6.
Pareto's law. The frequency distribution of income in the United States in 1918 is plotted on
log-log graph paper. The slope of the down-going straight line gives the power-law index.
Adapted from Montroll and Badger [
22
].
In all places and at all times the distribution of income in a stable economy, when the origin of
measurement is at a sufficiently high income level, will be given approximately by the empir-
ical formula
y
=
ax
−
ν
,where
y
is the number of people having income
x
or greater and
ν
is
approximately 1.5.
In Figure
1.6
the income distribution of people in the United States in 1918 is depicted
on graph paper, where both axes are logarithmic. On the vertical axis is the logarithm
of the number of individuals with a given level of income and on the horizontal axis is
the logarithm of the income level. The closed circles are the data showing the number
of people with a given level of income and the solid-line segment with a negative slope
indicates Pareto's law of income [
25
] fit to the data. It is from such curves as the one
shown in Figure
1.6
that Pareto sought to understand how wealth was distributed in
western societies, and, from this understanding, determine how such societies operate.
Unlike the normal distribution, for which the measurements cluster in the vicinity of
the average value, with 95% of the population residing between +2 and
2 standard
deviations of the average; income data are broadly spread out with some individuals at
either extreme. The region of the distribution where the large values of income exist is
the tail, and is called the tail because the income levels are far from the central region,
where one would expect the mean income of ordinary wage earners to reside. Such
observations lead Pareto to draw the following conclusion [
25
]:
−
These results are very remarkable
...
The form of this curve seems to depend only tenuously
upon different economic conditions of the countries considered, since the effects are very nearly
the same for the countries whose economic conditions are as different as those of England, of
Ireland, of Germany, of the Italian cities, and even of Peru.
Another conclusion that Pareto drew from his insight into the data structure is that
the world is not fair. If the world were fair then everyone would have almost the same
income, which would be the mean. In the world of Gauss that would be how income is
distributed, with some individuals making more than average and some making less than

