Information Technology Reference
In-Depth Information
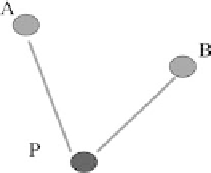
Figure 6.11.
This figure illustrates the concept of a triple. P is a friend of both A and B. Is A a friend of B? If
he/she is a friend, then A is linked to B and the triple is a triangle. If P is an actor, for instance
Marilyn Monroe, and she plays in a picture with both A, Tony Curtis, and B, Jack Lemmon,
does A play in the picture with B? In that case all three actors played in the same movie and the
triple is a triangle.
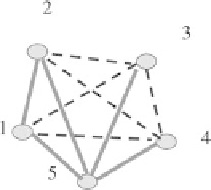
This figure illustrates the clustering definition proposed by Newman [
26
]. The full lines denote
the realized links. The dashed lines denote the potential links that are not realized.
Figure 6.12.
nodes, A and B. The nodes are assumed to represent agents A and B, who are friends of
P. We are interested in the probability that A is a friend of B. It is evident that, when the
probability of A being a friend of B is high, this is the signature of a community. How
can we measure the value of this property called
clustering
?
Newman [
26
] proposes the method illustrated by Figure
6.12
. The formula for the
clustering coefficient he proposed is
3
,
C
=
(6.79)
where
is the
number of
connected triples of vertices
. A triangle is a set of three nodes that are completely inter-
connected. In Figure
6.12
we see only one triangle, that constituted by nodes 1, 2 and
5. A triple is a set of three nodes with at least two links. If A is not linked to B (see
Figure
6.11
) these three nodes are a triple, but not yet a triangle. If A is linked to B, we
have a triangle. In a triangle there are three triples. This explains the factor of 3 in (
6.79
).
If all the possible triples are associated with a triangle, we get for
C
the maximum value
of 1. In Figure
6.12
we note that nodes 1 and 2 each correspond to a triple. The node 3
generates six triples, with
denotes the
number of triangles in the network
and
(
12
),(
14
),(
15
),(
24
),(
25
)
and
(
45
)
. Thus we obtain for the
clustering coefficient for the graph in Figure
6.12
3
8
.
=
(6.80)
C