Information Technology Reference
In-Depth Information
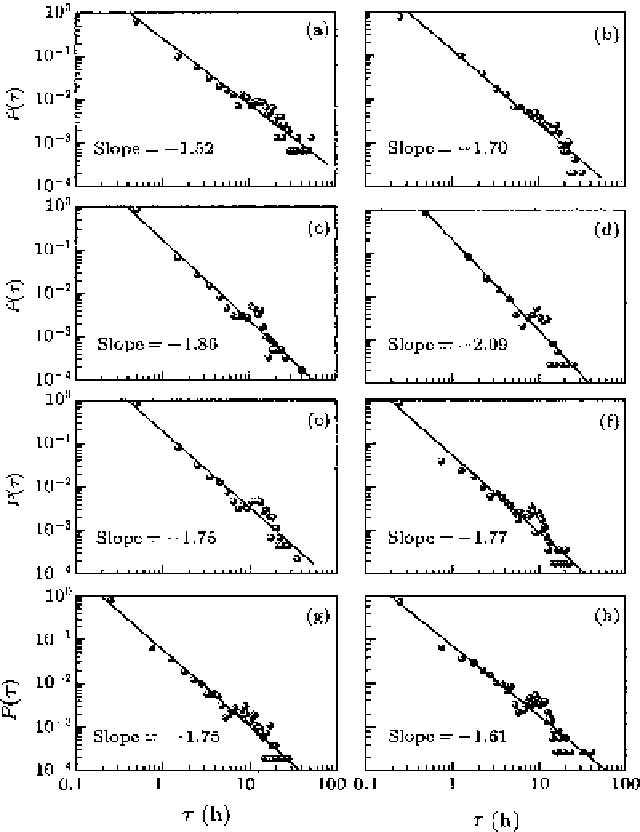
Figure 6.5.
The log-log plots of the inter-event time distributions. The black dots represent the empirical
data, and the straight lines are the linear fitting to the data. The panels (a)-(h) correspond to the
records of the participants A through H, respectively. This graph is reproduced from [
21
] with
permission.
property is easily accounted for by a small-world model proposed by Watts and Strogatz
[35] in 1998 that shows that real webs exist in a condition intermediate between order
and randomness. However, this model does not account for another important property
of real webs,
the scale-free condition
. The model of preferential attachment discussed
in the previous sections yields the inverse power-law coefficient
α
=
3, whereas for real
webs
ranges from 2 to 3. In the latter part of this section we present a concise review
of the work done to generate values of
α
smaller than 3. We conjecture that the large
clustering observed in real webs serves the purpose of facilitating the attainment of local
α