Information Technology Reference
In-Depth Information
11
10
9
8
7
6
5
4
3
6000
0
1000
2000
3000
Day
4000
5000
(2 Jan 75)
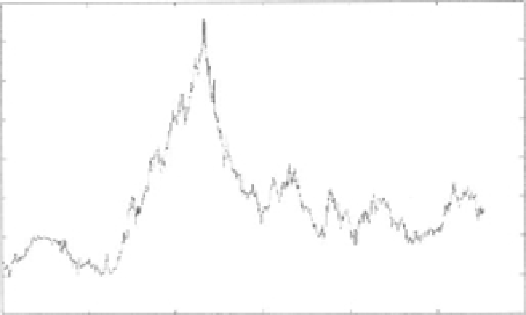
Figure 4.6.
The time series for the FRF/USD currency exchange time series from 1/2/75 to 1/15/99 with a
total of 5,529 data points [
36
]. Reproduced with permission.
10
8
6
4
Slope
=
-2.8567
2
0
-2
-4
-6
-9
-6
-5.5
-5
-4.5
-4
-8.5
-8
-7.5
-7
-6.5
log
|λ|
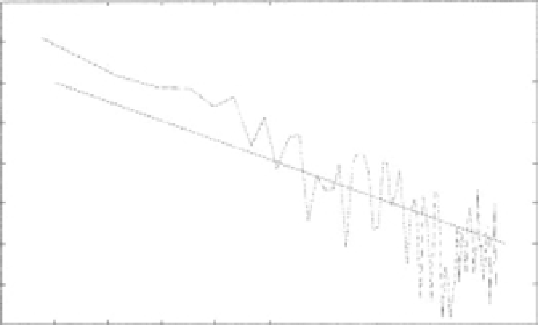
The power spectral density for the FRF/USD currency exchange time series from 1/2/75 to
1/15/99 with a slope of -2.86 and a corresponding Hurst exponent of
H
=
0
.
93 [
36
].
Reproduced with permission.
Figure 4.7.
such as that shown in Figure
4.6
, which is a combination of short-time variations and
long-time excursions.
The typical financial time series in Figure
4.6
gives rise to the inverse power-law
spectral density shown in Figure
4.7
. The best fit to the individual slopes of the spec-
tra lies in the interval
−
2
.
86
≤
slope
≤−
2
.
11. The individual slopes are associated
with
−
(
2
H
+
1
)
in the spectral density, so the Hurst parameter lies in the inter-
val 0
Pesee argues that since the Hurst indices for JPY/USD and
EUR/USD approach 0.5 there is no memory in these cases and these financial time
series can be represented by standard random walks, similarly to the observation made
by Bachelier. On the other hand, there is clear evidence of the long-time memory for
.
55
≤
H
≤
0
.
93
.