Information Technology Reference
In-Depth Information
the ultimate failure of the material to the applied stress. Up to this point the distributions
have been phenomenological in that the failure rates have been chosen to accurately
describe a given data set. Subsequently we show a dynamical basis for the Weibull
distribution as well as others.
It is worth studying the general case of the rate
]
η
g
(
t
)
=
r
0
[
1
+
r
1
t
(3.233)
in terms of three parameters. In the long-time limit
t
1
/
r
1
the general rate becomes
equivalent to the mortality risk (
3.230
) with
η
=
β
−
.
1
(3.234)
By expanding the general form of the rate (
3.233
) in a Taylor series,
)
η
1
η
1
r
1
t
)
η
,
g
(
t
)
=
r
0
(
r
1
t
+
≈
r
0
(
r
1
t
and comparing it with (
3.230
), we obtain for the lumped parameter
r
0
r
1
η
+
α
=
1
.
(3.235)
The border between where the Weibull distribution has a maximum at
t
>
0(for
η>
0
)
and the region where it diverges at the origin is at
η
=
0
.
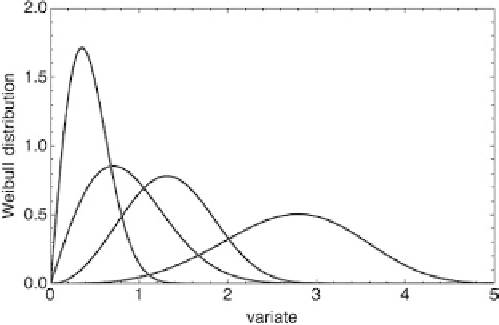
The emergence of a maximum
at
t
.
The adoption of (
3.233
) serves the purpose of turning this divergent behavior into a
distribution density with a finite value at
t
>
0 is clearly depicted in Figure
3.9
, which illustrates some cases with
β>
1
=
0:
exp
1
[1
r
0
r
1
1
r
1
t
]
1
+
η
−
(
t
)
=
−
+
.
(3.236)
1
+
η
/β
, where the lumped parameter is
givenby(
3.235
) and from left to right
λ
is 0.5, 1.0, 1.5 and 3.0, respectively.
1
Figure 3.9.
The four curves depicted have values of
β
=
2and
λ
=
1
/α