Information Technology Reference
In-Depth Information
The spectrum corresponding to the correlation coefficient (
3.213
) can be determined
from a Tauberian theorem to be
1
S
(ω)
∝
1
,
(3.214)
ω
2
H
−
where it is clear that for
H
2 the spectrum increases with frequency. Are there
natural complex webs that behave in this way? The answer to this question is yes. In
fact, one of the first complex webs to be systematically studied was the beating of the
human heart and the statistics of the change in the time intervals between beats were
found to behave in this way.
Heart-rate time series are constructed by recording the time interval between adja-
cent beats as data, for example, let
<
1
/
1,
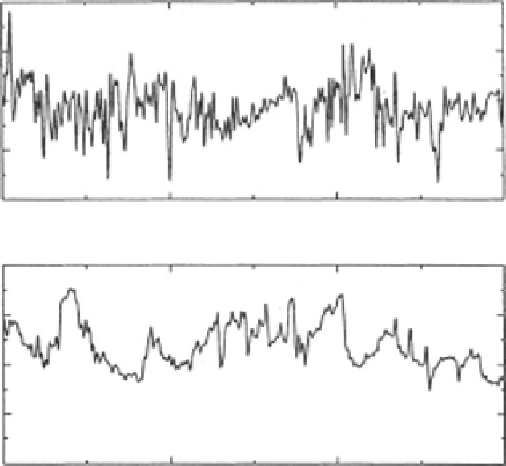
measured as the distance between maxima on an electrocardiogram. In direct con-
tradiction to the notion of “normal sinus rhythm” the interval between beats of the
human heart has a great deal of variability, as shown in Figure
3.7
. The mecha-
nism for this variability apparently arises from a number of sources as discussed in
Chapter
2
.
The power spectrum, the square of the Fourier transform of the increments of the
time intervals
I
f
(
n
)
be the interval between beats
n
and
n
+
(
n
)
=
f
(
n
+
1
)
−
f
(
n
)
, was determined by Peng
et al
.[
38
]tobegiven
(a)
0.9
0.8
0.7
0.6
0.5
0
1
2
3
4
5
6
Beat Number
n
(b)
0.9
0.8
0.7
0.6
0.5
0
1
2
3
4
5
6
Beat Number
n
The interbeat interval
f
(
n
)
after low-pass filtering the time series for (a) a healthy subject and
(b) a patient with severe cardiac disease (dilated cardiomyopathy). The healthy-heartbeat time
series shows more complex fluctuations than those in the diseased case [
38
]. Reproduced with
permission.
Figure 3.7.