Information Technology Reference
In-Depth Information
3
regular
2.8
2.6
2.4
random
2.2
2
1.8
3
3.2
3.4
3.6
Log average
3.8
4
4.2
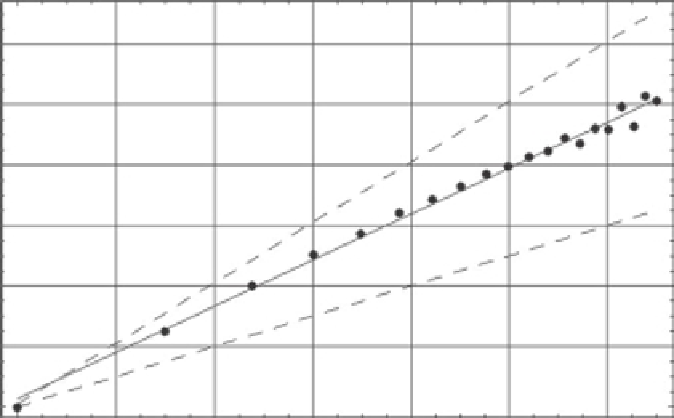
Figure 2.20.
The logarithm of the standard deviation plotted versus the logarithm of the average value for the
heartbeat interval time series for a young adult male, using sequential values of the aggregation
number. The solid line is the best fit to the aggregated data points and yields a fractal dimension
of
D
=
.
24 midway between those of the curve for a regular process and that for an
uncorrelated random process [
100
]. Reproduced with permission.
1
points. Moving from left to right, the next data point is constructed from the time series
with two nearest-neighbor data points added together; and the procedure is repeated
moving right until the right-most data point has a block of twenty data points added
together. The solid line is the best linear regression on the data and represents the scaling
with a positive slope of 0.76. We can see that the slope of the HRV data is midway
between those of the dashed curves depicting an uncorrelated random process (slope =
1/2) and one that is deterministically regular (slope = 1).
Figure
2.20
implies that heartbeat intervals do not form an uncorrelated random
sequence. This implication is tested by randomly changing the order of the time inter-
vals and, since no intervals are added or deleted, the statistics of the intervals is not
changed by such a change in ordering. The correlation, on the other hand, depends on
the ordering of the data points, so the scaling is lost by this shuffling process. This is
shown in Figure
2.21
, where the information (entropy) is plotted versus the logarithm
of time and the functional form
dx p
S
(
t
)
=−
(
x
,
t
)
log
2
p
(
x
,
t
)
=
δ
log
2
t
+ constant
(2.83)
is obtained when the probability density scales as
F
x
t
δ
.
1
t
δ
p
(
x
,
t
)
=
(2.84)