HTML and CSS Reference
In-Depth Information
much optimization left to do here. In a larger game with lots of assets loading from different servers, you'll have
more to optimize.
Clicking an individual request shows you all the details of the request and the server's response. If your code
talks back to the server via Ajax calls, the tab becomes even more invaluable because you can trace the paramet-
ers and response of the server. Websockets, as of this writing, aren't supported by developer tools to the extent
that you can see the data passed back and forth, so you need to log any data you need to see.
Debugging JavaScript
Because HTML5 games are heavy on JavaScript, you'll often want to inspect your running game when stuff
goes wrong or behaves unexpectedly. Luckily, Developer Tools provides a debugging environment that is
second to none, allowing you to look at the objects, functions, and values as well as stop your game's execution
at a specific point and look at the exact state of the game.
Examining the Console Tab
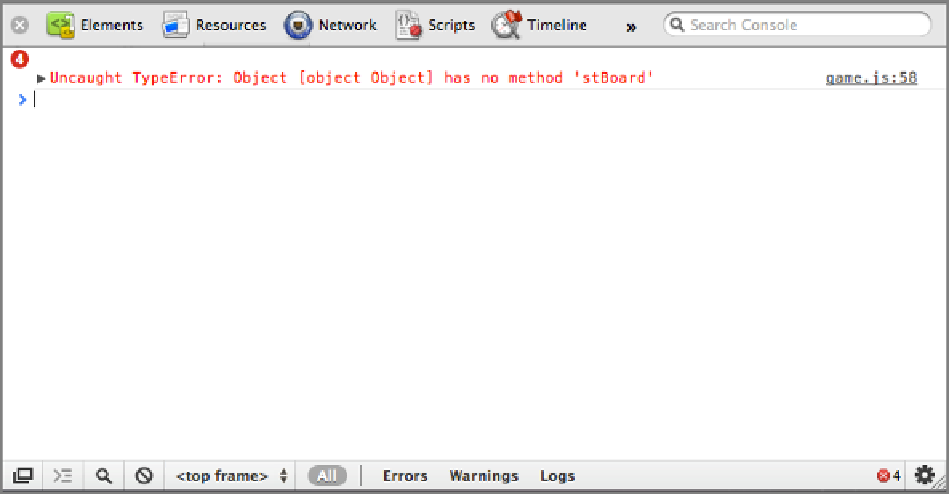
Your first stop when something goes wrong should be the Console tab. It alerts you to any JavaScript errors that
have occurred while running your game. Errors are highlighted in red, and you get a filename and line number
where the error occurred (see
Figure 7-8
).
Figure 7-8:
A JavaScript error in the console.
Clicking the filename on the right takes you to the file where the problem occurred and with the offending
line highlighted (see
Figure 7-9
)
. You can click the little arrow to the left of the error to open the callback, which
shows you all the nested function calls needed to get to the current line.