Game Development Reference
In-Depth Information
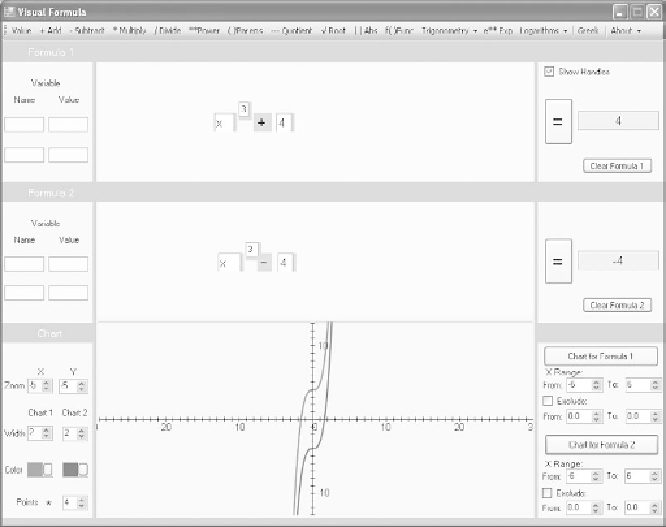
Figure 10.29
The translated results of a function that contains a cube creates a graph that is symmetrical to a line.
2. Click the Power menu item. Then click to the upper right of the Value field
to position the Exponent field. After you position the Exponent field, type 3
in it.
3. Now click the Add menu item and in the equation composition area, click to
the right of the Value field to position the plus sign the Add menu item
provides.
4. Click the Value menu item. To position the Value field, click after the plus
sign. This is the y-intercept of the equation. Type 4 in the field.
5. Set the Zoom values to
5.
6. To generate the graph, locate the lower-right panel and click the Chart for
Formula 1 button. As Figure 10.29 reveals, the cubic exponent, combined