Game Development Reference
In-Depth Information
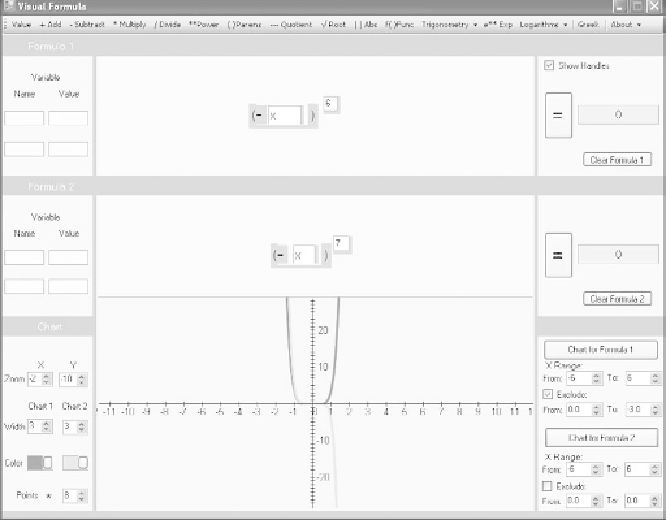
5. Now in the lower-right panel, click on the Chart for Formula 1 button.
The graph shown in Figure 10.18 appears in the Cartesian plane.
6. To thicken the line for the graph so that it appears as shown in
Figure 10.18, click on the Chart 1 Width field in the Chart panel. You
can also use the Color palette to select a darker color.
Now add a second equation that generates a graph using an odd exponent. When
you use a negative sign with the base value in an equation that contains an odd
exponent, the upper arm of the graph extends up into quadrant II, while the lower
arm extends down into quadrant IV. To see how this is so, refer to Figure 10.19
and use the following steps:
1. If you have not done so, position the mouse cursor on the top edge of the
Cartesian plane. When it becomes a horizontal bar with arrows extending
up and down, pull the Cartesian plane down so that the lower equation
composition area is exposed.
Figure 10.19
The exponent with an odd number generates a graph symmetrical to the origin of the Cartesian plane.