Game Development Reference
In-Depth Information
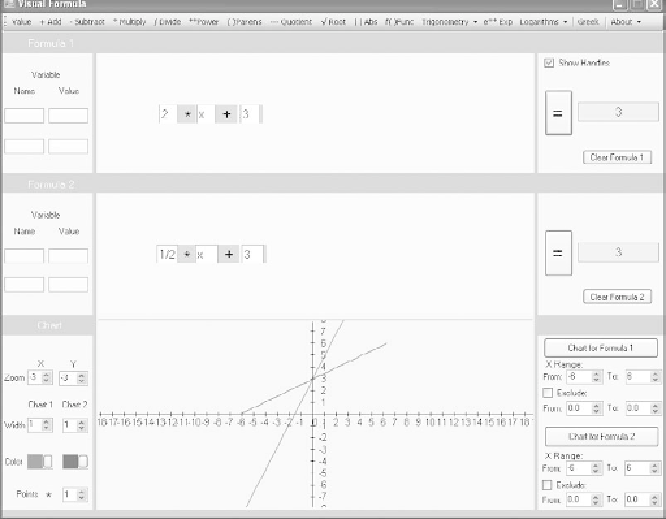
Figure 10.7
Use both composition areas to graph contrasting equations.
4. After setting up the Value field for
x
, click the Add menu item. Then click in
the composition area to place the plus sign immediately after the
x
Value
field.
5. Now click the Value menu item. To position the corresponding field, click
in the composition area to the right of the plus sign. This field is for the
y-intercept. Enter 3 in this field.
Having implemented the equation, click the Chart for Formula 2 button. As
Figure 10.7 illustrates, the shorter, more gradually sloped line appears. To change
the color of the line, click Color option on the Chart panel and select from the
color palette.
You can use a similar approach to generate graphs for other linear equations.
Table 10.1 provides some of the common forms of linear equations. Work
through the examples the table provides.