Game Development Reference
In-Depth Information
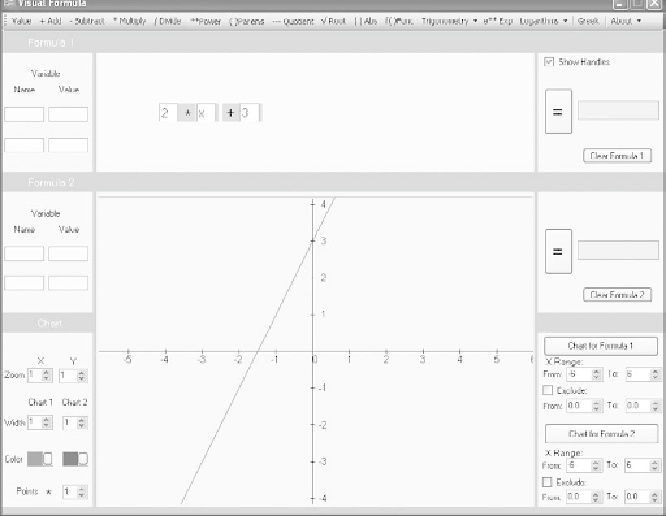
Figure 10.1
Create and graph a linear equation.
Now you can proceed to generate a graphical representation of the equation.
Toward this end, first move the cursor to the top of the Cartesian plane. As you do
so, the cursor turns into a horizontal line with arrows extending up and down.
Press the left mouse button and pull the Cartesian plane upward until its top edge
is even with the bottom of the composition area that contains your equation.
Figure 10.1 illustrates Visual Formula after you have extended the Cartesian plane.
Having extended the Cartesian plane, you are ready to generate the line. To
accomplish this, click on the Chart for Formula 1 button on the lower right panel
of the Visual Formula window. You see the line illustrated in Figure 10.1.
Changing the Intercept Value
To work with the linear equation you have set up in the previous exercise, find
the y-intercept field in your equation in the composition area. You have assigned

