Game Development Reference
In-Depth Information
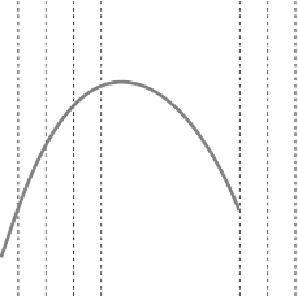
Figure 8.1
A polynomial establishes a hypothetical trend for the effect of a mosquito repellent.
To review the notion of a changing slope, consider Figure 8.1. To generate the
values for the graph shown in the figure, you use this equation:
06
a
2
0
:
þ
3
a þ
1
:
5
As the figure illustrates, the curve that results from calculating representative
values of
x
creates something akin to an arc tracing the path of an arrow. Along its
ascending path, the slope is consistent and resembles that of the graph of a linear
equation. Then the path changes and with it the slope. The slope evens out and
then turns downward.
The graph of this polynomial might represent the effectiveness of a given brand
of mosquito repellent in relation to the number of hours that elapse after you
apply it. Accordingly, for the first few hours, the number of mosquitoes that
alight and immediately retreat without biting increases consistently. After around
25 hours, however, this trend changes. At a declining rate, the mosquitoes fail to
retreat, and the trend shows that after roughly 50 hours, the effects of the repellent
completely disappear.
A polynomial function allows you to trace such changing trends because its slope
does not remain consistent throughout its extent. In the instance of the mosquito
repellent, the slope changes from one moving in a positive direction to one