Game Development Reference
In-Depth Information
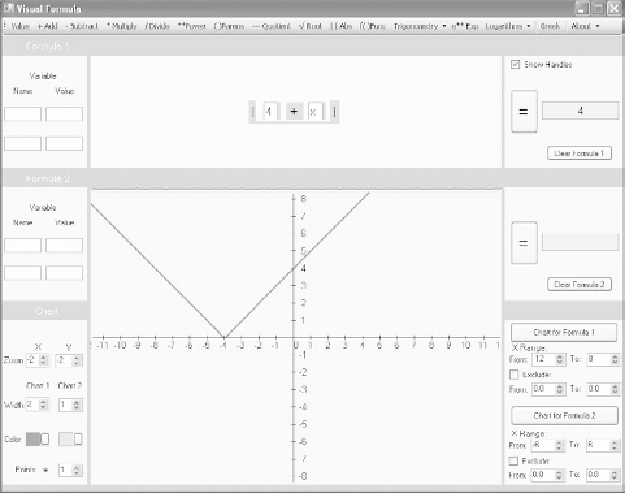
Figure 7.11
Adding to the number inside the absolute value bars shifts the graph to the left.
4. Click the Value menu item again and position the field after the plus sign
and inside the absolute value bars. Click in the field and type
x
.
5. In the lower part of the Visual Formula window, move the cursor to the top of
the Cartesian plane so that it turns into parallel bars. Pull the Cartesian plane
up until it is even with the bottom of the top equation composition area.
6. In the lower-right panel find the From and To fields for the X Range setting
beneath the Chart for Formula 1 button. Click the To control and set the
value to
12. Click the From control and set the value to 8.
7. In the lower-left-panel, find the Zoom label. Click the controls for the X and
Y fields for the Zoom label, and set both fields to
2.
8. In the Chart 1 area, set the Width field to 2.
9. Click the Chart for Formula 1 button. You see the graph shown in
Figure 7.11.