Java Reference
In-Depth Information
Figure 13-6.
The debugger window when the AbstractScriptEngine.java file is
being debugged
Step into the
eval()
method call by pressing
F7
. The debugger will open a file named
<eval>.js
that contains the script from the
primetest.js
file that you were trying to
load through the Java code using a
Reader
. You can scroll through the script and set
breakpoints in the
<eval>.js
file. Figure
13-7
shows the file with two breakpoints—one at
line 21 and one at line 27.
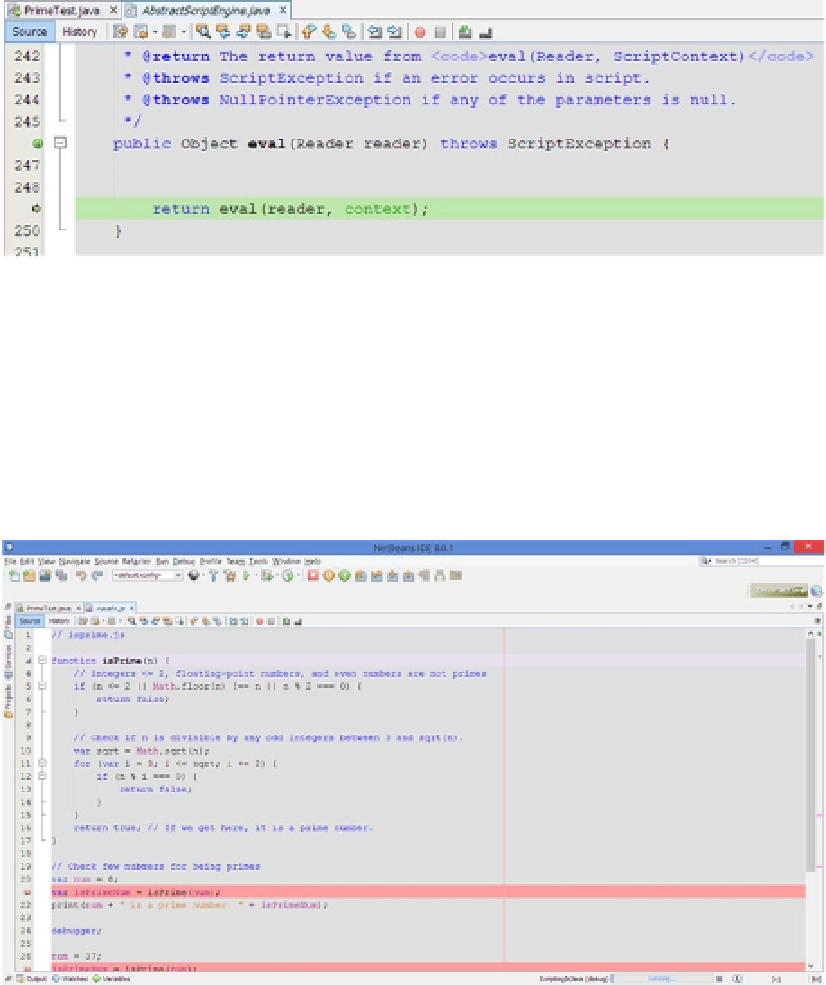
Figure 13-7.
The debugger window showing the loaded script in the <eval>.js file
After you have set the breakpoints in the script in the
<eval>.js
file, you are ready
to proceed with normal debugging actions. For example, the
Continue
debugging action
(
F5
) will stop the execution at the next breakpoint.
Search WWH ::

Custom Search