Java Reference
In-Depth Information
Figure 13-3.
A Nashorn script opened in the NetBeans IDE in an active debugging session
When the debugger session is active, you can use the debugging actions such as
step into, step over, step out, continue, and so on. These actions are available from the
main menu item named
Debug
as well as from the debugger toolbar. Figure
13-4
shows
the debugger toolbar. It appears by default when the debugger session is active. If it is not
visible when the debugger session is active, right click in the toolbar area and select the
Debug
menu item to make it visible. Table
13-1
contains the debugging actions available
for scripts with their shortcuts and descriptions.
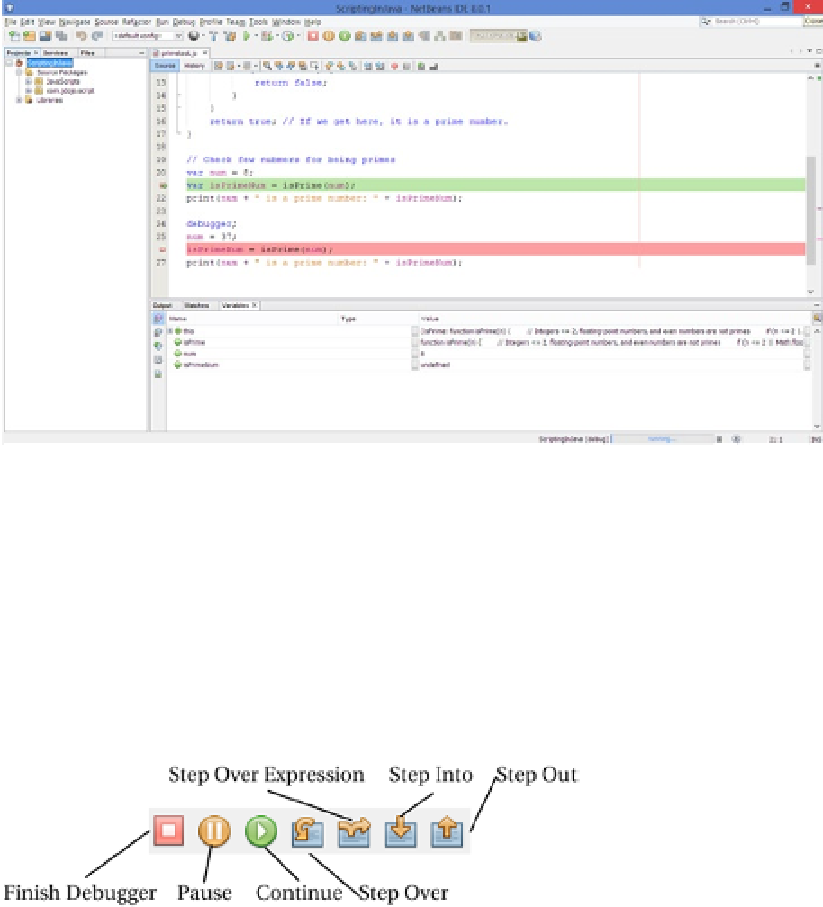
Figure 13-4.
The items in the debugger toolbar in NetBeans IDE
Search WWH ::

Custom Search