Environmental Engineering Reference
In-Depth Information
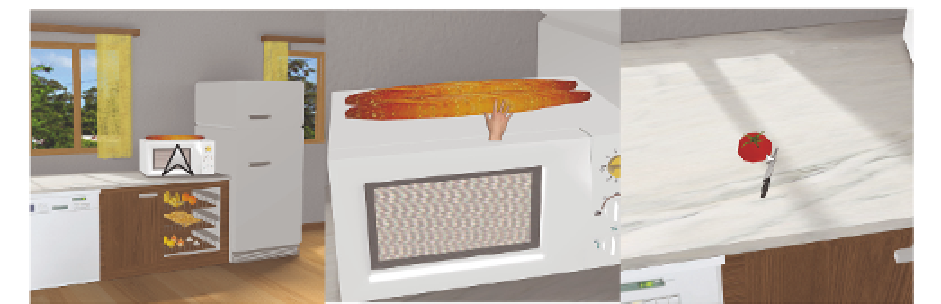
Fig. 9. The three cursor modes: at left an arrow on unreachable objects, in the middle an
animation of the hand on reachable objects and, for dragging, the arrow and the held object
conveniently scaled, here, the knife.
during a fixed time interval. Users answered questions about visibility, precision and visual
appearance. The results showed the more effective mechanismwas to show the grasped object
at a side of the cursor. Surprisingly, the opaque mode was preferred to the semi transparent
one, because it was found more natural.
Taking into account these results, we finally chose to have three cursor modes (see Figure 9):
when the object under the cursor is not reachable or an object is being held, we use an arrow
and when the object is reachable the animated hand.
Finally, to test the feedback mechanisms to help putting objects, we used a task consisting in
placing objects on the kitchen marble. Users did not need to pick them. As soon as they put
one, another was automatically grasped. We measured the number of objects that users were
able to leave on the marble, and users answered a questionnaire about precision and comfort.
The preferred mechanism was to color the 2D free space nearer the cursor.
5.2 Navigation methods test
To test the navigation methods we proposed a task consisting in touching two objects
strategically placed in the scenario (see Figure 10): an orange (dashed in blue) and a dish
(dashed in pink). The task is segmented in three stages. The first stage is to reach the orange.
In this stage, it is necessary to avoid the table, which is an obstacle that does not prevent from
seeing the target object. The next stage is to go to the cabinet's door, which consists of walking
in a straight line near the marble without obstacles. The last stage is to open the cabinet door
and walk around to reach the dish, which is an object placed into a container. Thus, the cabinet
door is an obstacle that prevents from seeing the target object. Figure 11 represents the paths
performed by the users in free navigation mode using a temperature range color encoding.
Temperatures are represented with a blue-to-red color scale. The most transited is the place
that represents the higher temperature. In other words, places where users stay during a long
time are colored in red.
Clearly, it can be seen that areas containing obstacles (near the table in the first stage and
near the door in the third stage) are critical for users. The area corresponding to the second
stage is also colored in red because when there are no obstacles, they all choose the same