Database Reference
In-Depth Information
'l2'
, False) for param in params]
print params
print metrics
plot(params, metrics)
fig = matplotlib.pyplot.gcf()
pyplot.xscale('log')
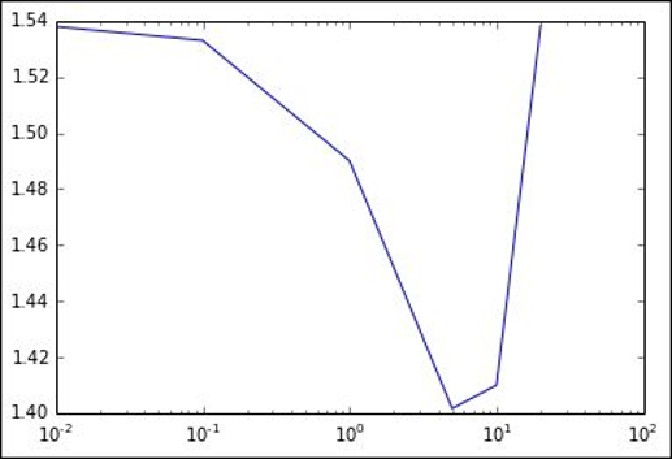
As expected, there is an optimal setting of the regularization parameter with respect to the
test set RMSLE:
[0.0, 0.01, 0.1, 1.0, 5.0, 10.0, 20.0]
[1.5384660954019971, 1.5379108106882864,
1.5329809395123755, 1.4900275345312988, 1.4016676336981468,
1.40998359211149, 1.5381771283158705]
This is easiest to see in the following plot (where we once more use the log scale for the
regularization parameter axis):
Metrics for varying levels of L2 regularization