Database Reference
In-Depth Information
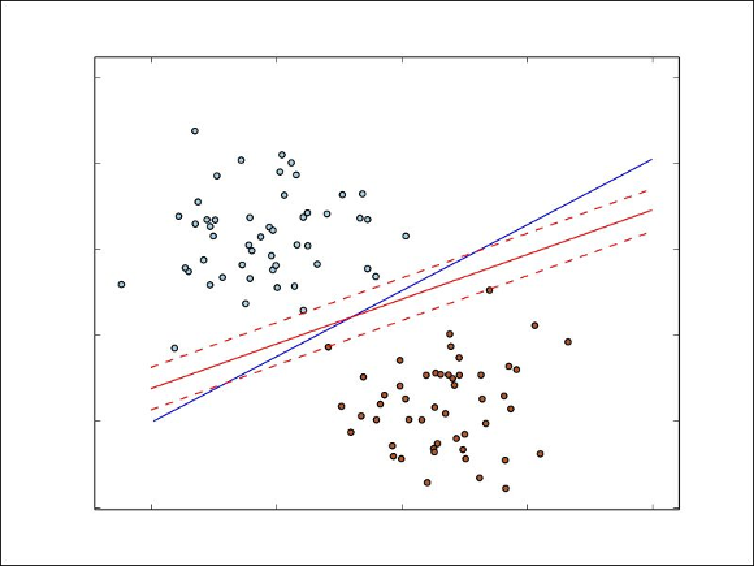
In the following image, we have plotted the different decision functions for logistic re-
gression (the blue line) and linear SVM (the red line), based on the simple binary classi-
fication example explained earlier.
You can see that the SVM effectively focuses on the points that lie closest to the decision
function (the margin lines are shown with red dashes):
Decision functions for logistic regression and linear SVM for binary classification