Database Reference
In-Depth Information
plt.bar(pos, y_axis, width, color='lightblue')
plt.xticks(rotation=30)
fig = matplotlib.pyplot.gcf()
fig.set_size_inches(16, 10)
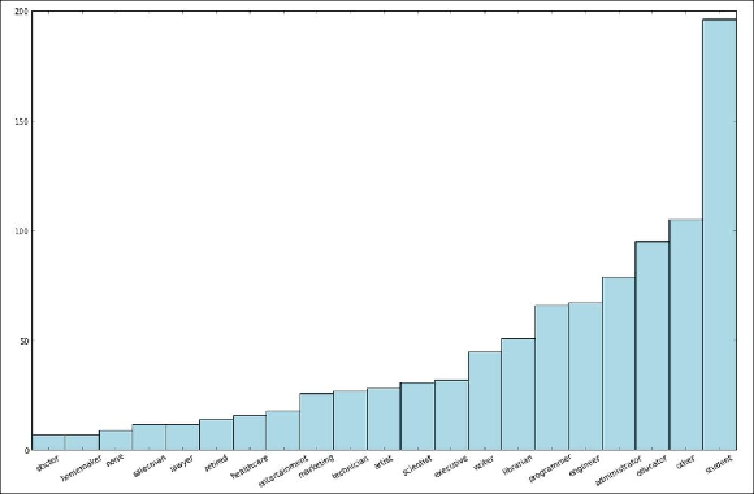
The image you have generated should look like the one here. It appears that the most pre-
valent occupations are
student
,
other
,
educator
,
administrator
,
engineer
, and
pro-
grammer
.
Distribution of user occupations
Spark provides a convenience method on RDDs called
countByValue
; this method
counts the occurrences of each unique value in the RDD and returns it to the driver as a
Python
dict
method (or a Scala or Java
Map
method). We can create the
count_by_occupation
variable using this method: