Biology Reference
In-Depth Information
PA L
12
4CL
S15A
11
10
9
8
7
6
1
6
11
16
21
26
31
36
41
46
51
Microarray number
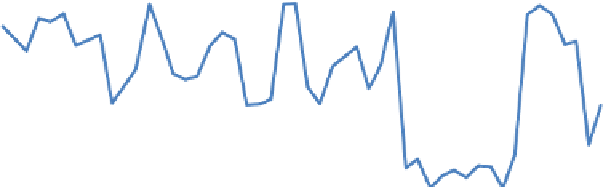
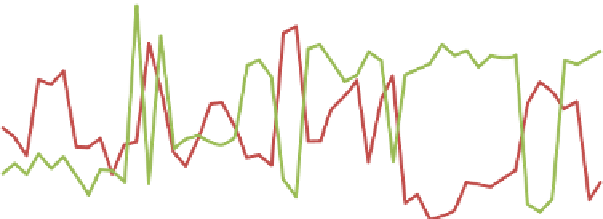
Fig. 2. Expression profiles of PAL (blue), 4CL (red) and ribosomal subunit S15A
(green) genes across different microarrays of Brachypodium distachyon. The x-axis
represents microarrays, while y-axis depicts the expression value of the genes. PAL,
4CL and S15A are represented by microarray probe sets Bradi3g49260.1R_st, Bra-
di3g05750.1R_st and Bradi2g23110.1R_st, respectively.
correlation), while r(PAL,S15A)
0.68 (negative correlation), which indi-
cates that PAL and 4CL are transcriptionally coordinated, while PAL and
S15A are not. Alternative co-expression metrics such as mutual information,
partial correlation, highest reciprocal rank and Spearman rank are also used in
several studies (reviewed in
Usadel et al., 2009
). Co-expression relationships
are often visualized as networks, where two genes correlated above a certain
r-value threshold are represented as connected nodes (
Usadel et al., 2009
).
Such representation of co-expression has the advantage of visual overview of
many co-expression relationships and permits analysis of co-expression rela-
tionships by advanced mathematical methods, such as clustering.
¼
A. A CASE OF STUDY: PAL CO-EXPRESSION NETWORK IN BRACHYPODIUM
A co-expression network of a PAL gene from Brachypodium can be seen in
Fig. 3
. The network was generated using PlaNet database (
Mutwil et al.,
2011
), loaded with microarrays covering wide range of tissues and develop-
mental stages for Brachypodium (Sibout and Mutwil et al., in preparation).
PlaNet-mediated analysis of the network centred on Bradi3g49260 reveals
that this member of PAL family is co-expressed with other proteins known
to be involved in biosynthesis of lignin, namely Myb, PAL, C3H/C4H,
HCT, CAD and 4CL. Ontology analysis of the network indicate significant