Game Development Reference
In-Depth Information
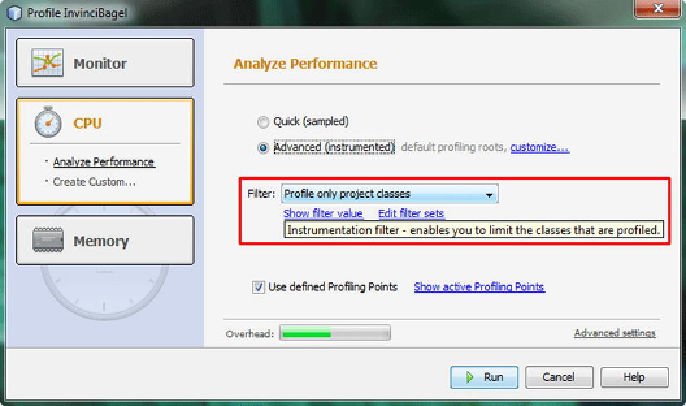
Using the Profile Project menu item or shortcut icon will open the
Profile InvinciBa-
gel
(your game project's name) dialog, as shown in
Figure 2-14
. Let's click the center
CPU
button at the left of the dialog, which will put the dialog in
Analyze Perform-
ance
(selection characteristics) mode. You will look at profiling
memory
use a bit later
on (see the section “Profiling Your Java 8 Game Application Memory Usage”). The
Monitor
(button) option enables real-time thread monitoring, which can be used while
you write your Java code.
Figure 2-14
.
Set the filter, using the drop-down menu in the Profile Project dialog, and select the Advanced (instru-
mented) output setting
In this dialog, you can select a
Quick profile
or an
Advanced profile
, which has
graphical instruments that show the performance visually. As you can see, this is the
option selected as well as the
Profile only project classes
option from the
Instru-
mentation Filter
drop-down menu. Leave
Use defined Profiling Points
selected to
get NetBeans 8.0 to do the maximum amount of profiling work possible. Note as well
the
Overhead
gauge (indicator) at the bottom of the dialog, indicating a 50 percent
value.
The first time that you run the NetBeans profiling tool, it needs to
calibrate
your
workstation, as every workstation will have different characteristics, such as the
amount of memory and number of CPU cores, or processors.