Game Development Reference
In-Depth Information
Figure 7-11
.
Use a Profile
Profile Project menu sequence to start the Profiler and look at GamePlayLoop
memory use
Next, let's study the threads analysis pane by scrolling down in the Profiler tab,
shown at the top left of
Figure 7-11
.
Find the
Threads
iconNetBeans will ask you if
you want to start the threads analysis tool; once you agree, it will open the Threads tab
(see
Figure 7-12
).
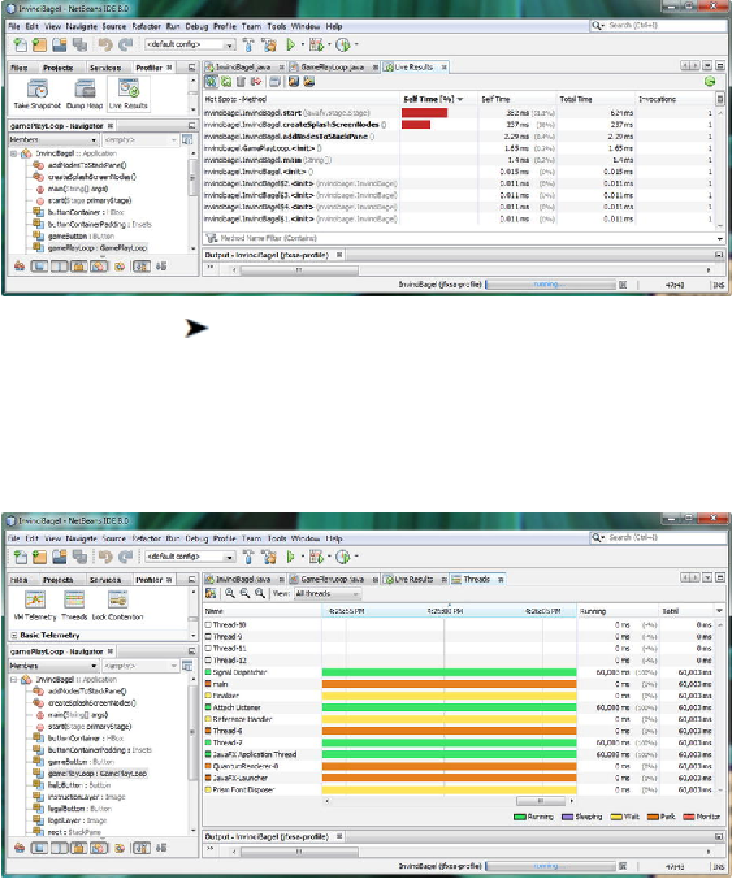
Figure 7-12
.
Click the Threads icon, seen at the left of the screen, and open the Threads tab; the same eleven threads
are running