Environmental Engineering Reference
In-Depth Information
(a)
1.02
1.03
1.04
(b)
1.02
1.03
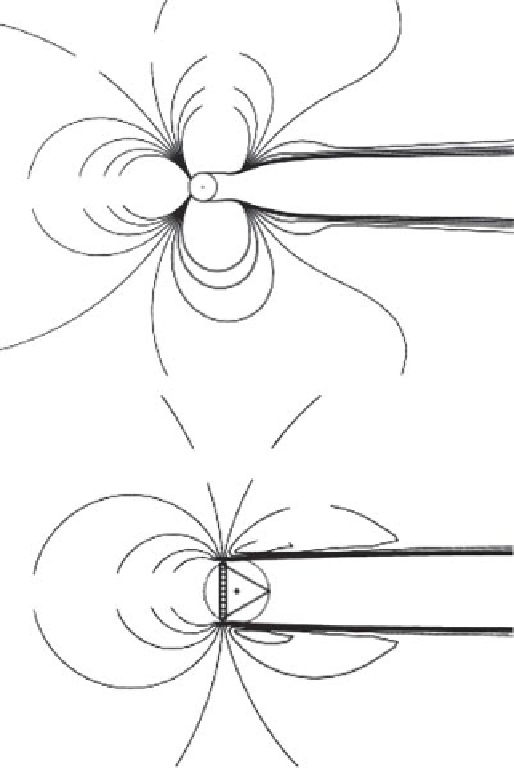
Figure 5-7.
Illustration of how the airflow is distorted close to the tower: (a) a tubular tower and
(b) a lattice tower. The wind approaches from the left side of each image. The lines represent
contours of constant ratio of the disturbed wind speed to the free-stream wind speed.
Source:
IEC 61 400-12, Annex G-Mounting of Instruments on the Meteorology Mast.
5.7.2 Wind Vanes
Wind vanes are generally deployed at two heights. It is customary to install them on
booms that are at least 1 m below the nearest anemometer booms to avoid interference
with the speed measurements. If it is not practical to mount a vane on its own boom,
it should be placed on the anemometer boom about halfway between the anemometer
and the tower face. This ensures that the vane disturbs the anemometer readings only
when the anemometer is already in the tower's shadow. In addition, it is recommended


Search WWH ::

Custom Search