Environmental Engineering Reference
In-Depth Information
12
10
8
6
4
2
0
0
10
20
30
40
50
60
70
80
90
100
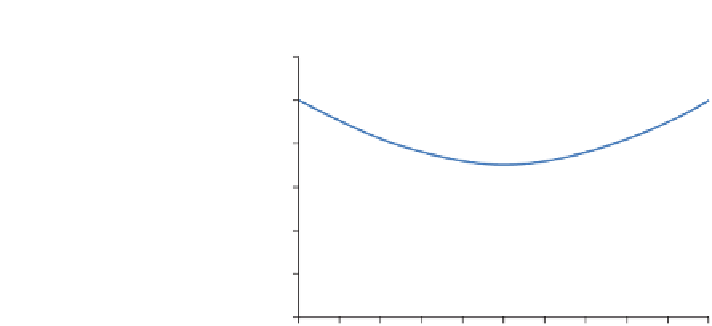
Number of turbines associated with mast A
Figure 15-2.
Variation of the combined uncorrelated uncertainty in the array-average wind
speed for the case of two masts as a function of the number of turbines associated with one
of the masts (mast A). The rest of the turbines are assumed to be associated with mast B. The
uncertainty based on either mast alone is assumed to be 10%.
Source:
AWS Truepower.
Now, all the elements are in place to combine the uncertainties from multiple masts.
Although the process may seem rather involved at first glance, Equations 15.7 and 15.8
can be applied easily in a spreadsheet program once the essential decision, whether a
particular uncertainty component is to be treated as correlated or uncorrelated between
masts, is made. Table 15-2 provides an example with five masts, for which it has been
assumed that the historical and future wind resource uncertainties are correlated across
masts (but not with each other) and that all other uncertainties are uncorrelated. To
be done correctly, the uncertainties should
not
be totaled for each mast first. Instead,
each separate uncertainty component should be combined across masts (i.e., down
each column, as indicated by the arrows) according to whether it is correlated or
uncorrelated. Then the combined uncertainties should be totaled (i.e., across the bottom
row) assuming they are all uncorrelated.
7
The resulting total combined uncertainty in this case, 4.3%, is part way between
the results that would be obtained when assuming all uncertainties are uncorrelated
(3.1%) and when assuming all the uncertainties are correlated (6.7%). This shows how
purely correlated and uncorrelated errors combine to produce a partial correlation.
As a final note of caution, the assumption that uncertainties are uncorrelated is a
tempting one, given the benefits that accrue from using the sum-of-the-squares rule;
but it can be optimistic. The history of wind energy development is replete with cases
in which it was assumed that errors from different sources were random and unrelated,
whereas they were in fact biased in consistent ways. For example, at one time it was
common practice to mount anemometers vertically off the tops of towers on short
7
A more sophisticated uncertainty analysis can be performed using statistical packages available from a
number of vendors such as Palisades, GoldSim, and Lumenaut. These packages are designed to simulate
complex statistical problems involving numerous partially correlated and covariant variables.


Search WWH ::

Custom Search