Environmental Engineering Reference
In-Depth Information
(a)
Altamont wind speed map at 30 m
Mean speed
<4.5
4.5-5.0
5.0-5.5
5.5-6.0
6.0-6.5
6.5-7.0
7.0-7.5
7.5-8.0
8.0-8.5
>8.5
Sitewind
WAsP
121°45'
121°40'
121°35'
121°30'
121°45'
121°40'
121°35'
10'
3
5'
3
0'
3
121°45'
121°40'
121°35'
121°30'
121°45'
121°40'
121°35'
121°30'
3
0
3
6
9
12 km
(b)
Growth of error with distance
4
Sitewind
WAsP
3.5
3
2.5
2
1.5
1
0.5
0
0
5000
10,000
15,000
20,000
25,000
Distance (m)
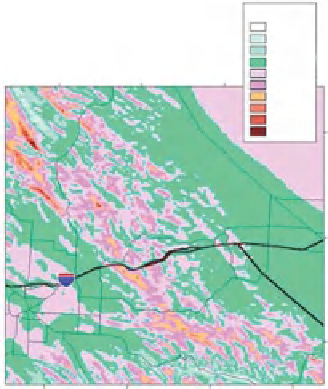
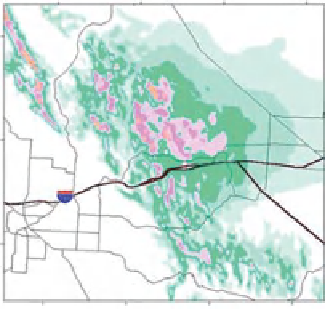
Figure 13-6.
(a) Wind resource maps of the Altamont Pass, California, created by the SiteWind
mesoscale-microscale modeling system (left) and by WAsP (right). The SiteWind map shows
the wind resource concentrated on the eastern slopes, the result of gravity acting on rela-
tively cool, dense marine air. WAsP suggests the wind resource is more widely distributed
and is at a maximum at the top of the pass. (b) Comparison with observations indicates the
mesoscale-microscale modeling is more correct, and that errors grow more rapidly with distance
from the reference mast for WASP than for Sitewind (17).


Search WWH ::

Custom Search