Environmental Engineering Reference
In-Depth Information
9.3 POST-VALIDATION ADJUSTMENTS
Good sensors mounted correctly should provide accurate measurements of wind
speed, direction, and other meteorological parameters most of the time. However,
there are several factors that often need to be considered to accurately estimate
the true free-stream speed. This section addresses three types of adjustment: tower
effects, turbulence, and inclined flow. Some adjustments apply to only certain types
of anemometers.
9.3.1 Tower Effects
Even outside the zone of direct tower shadow, the presence of the tower can increase
or decrease the observed wind speed compared to the true free-stream speed. The
effect depends on direction, the sensor's distance from the tower, and the tower width
and type. For a “goal post” configuration above the tower, the effect may be negligible.
Directly upwind, a tower impedes the wind, reducing the speed; over certain angles
on either side of the tower, the tower causes the wind flow to accelerate, producing
an increase in the observed speed (refer to Fig. 5-7). These effects are often readily
apparent in a scatter plot of speed ratios by direction for a pair of sensors at the same
height (Fig. 9-3).
Depending on the boom length and tower geometry, secondary tower effects such
as these can be up to several percent, a significant impact for resource assessment,
especially if the wind comes often from a narrow range of directions. For example,
it was once quite common to place anemometer booms 180
◦
apart and perpendicular
to the prevailing wind direction. For a tubular tower, this configuration tends to result
in an overestimate of the free-stream mean speed at both sensors.
Mast data
Expected
Mast data
Expected
1.4
1.4
1.2
1.2
1.0
1.0
0.8
0.8
0.6
0.6
0
50
100
150
200
250
300
350
0
50
100
150
200
250
300
350
Wind direction
Wind direction
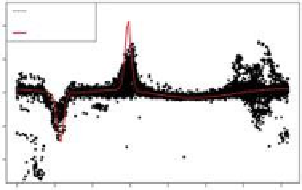
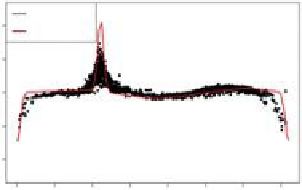
Figure 9-3.
Plots of speed ratios as a function of wind direction for pairs of anemometers
at the same height. The red lines are the result of a computational fluid dynamical model of
the tower effects. The prominent dips and spikes in both charts represent the effect of tower
shadow. Note that the implied boom direction is 180
◦
opposite the wind direction. (a) A normal
degree of scatter and secondary tower influences outside the shadow directions. (b) Relatively
large secondary influences, which may be due to equipment or obstructions on the tower.
Source
: AWS Truepower.


Search WWH ::

Custom Search