Environmental Engineering Reference
In-Depth Information
(except when one anemometer is in the tower shadow); wind shears between heights
should fall within reasonable bounds (which may vary diurnally and seasonally).
Table 9-2 gives examples of several relational test criteria for 10-min data. These
tests should ensure that physically improbable situations (such as a significantly higher
speed at 25 m compared to 40 m) are scrutinized. Comparisons between paired sensors
at the same height are especially valuable.
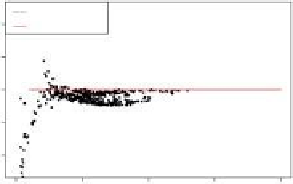
Scatter plots of the speed ratio between a pair of sensors at the same height as
a function of speed can be helpful for detecting problems. Figure 9-2 illustrates two
cases, the first exhibiting a normal degree of scatter and the second an abnormal degree
caused most likely by degradation or damage in one or both of the anemometers.
Table 9-2.
Examples of relational test criteria
Parameter
a
Validation criteria
Wind Speed
Max. gust vs average
Max. gust
≤
2
.
5
×
Avg.
60/40 m Average difference
≤
3 m/s
60/40 m Daily Max. difference
≤
5 m/s
60/25 m Average difference
≤
5 m/s
60/25 m Daily Max. difference
≤
8 m/s
Wind Speed: Same Height
Average difference
≤
0
.
5 m/s
Maximum difference
≤
3
.
0 m/s
Wind Direction
60/25 m Average difference
≤
20
◦
Wind Shear
Varies with terrain
b
−
.
<α
<
.
60/25 m Average
0
05
0
45
a
All monitoring levels except where noted.
Source:
AWS Truepower.
b
Wind shear exponent.
Mast data
Expected
Mast data
Expected
1.4
1.4
1.2
1.2
1.0
1.0
0.8
0.8
0.6
0.6
0
5
10
15
20
0
5
10
15
20
Wind speed (m/s)
Wind speed (m/s)
Figure 9-2.
Plots of speed ratios as a function of wind speed for pairs of anemometers at the
same height. (a) A generally tight relationship with a normal degree of scatter at low speeds.
(b) This chart suggests that at least one of the two sensors is not performing to specification.
Source
: AWS Truepower.


Search WWH ::

Custom Search