HTML and CSS Reference
In-Depth Information
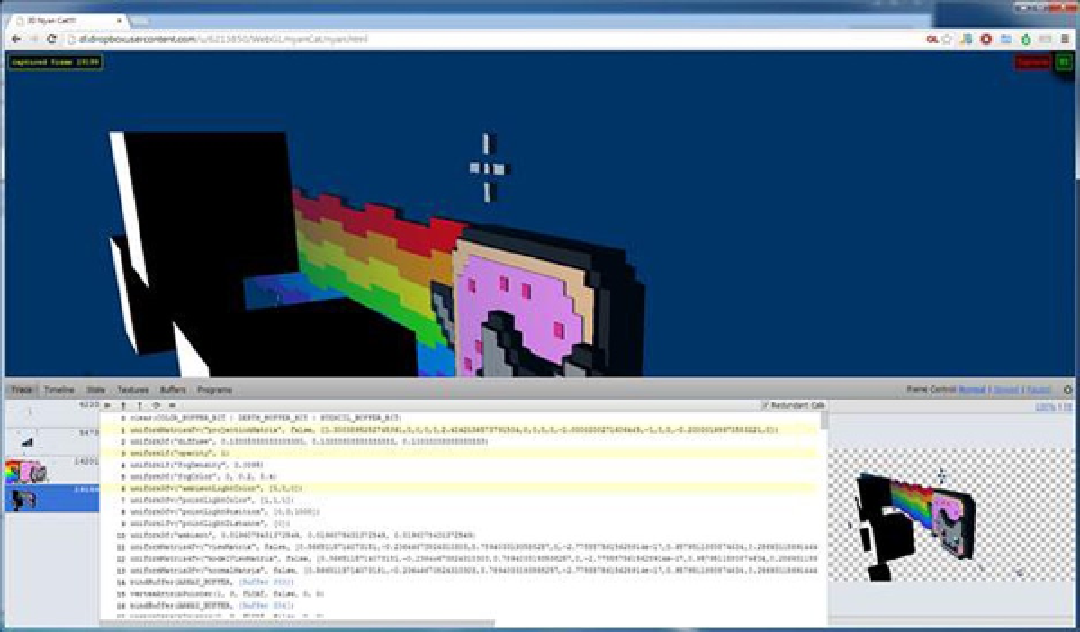
Figure 9-2.
The WebGL Inspector
The extension allows the entire state of a single frame to be examined. Each call made to the API is recorded and
can be played back in the window, making it simple to see what the rendering looks like step by step. The extension
can also show what redundant calls were made to the API, which can be used to diagnose how the renderer is doing.
Another feature of the extension is its ability to observe the contents of various buffers within the context. This
includes textures, vertex buffers, and index buffers. Shader programs, including the source code that makes up the
vertex and fragment stages, can also bestudied. Finally, the state of the API, such as what is enabled or disabled on the
pipeline, can be seen within the user interface (UI).
There is another option that just relies on Chrome itself, the Canvas Profiler, which introspects not only WebGL
usage, but Canvas 2D Context API usage as well. At the time of writing, the profiler is not as robust as as WebGL
Inspector, but it is likely to gain the same sort of functionality as its development continues. To signal that the tool is
still under development, it is currently hidden behind the Experiments tab in Chrome DevTools and has to be enabled
before it will appear under the Profiles section of the tools. If the Experiments tab is not present within the DevTools
settings, then it needs to be enabled through
chrome://flags
by turning on the Developer Tools Experiments option.
Once deemed ready for mass consumption, it should be available without any further configuration within the
browser.
Once up and running, the profiler can capture calls to the API. The biggest piece of functionality available in
Canvas Profiler that is not present in WebGL Inspector is the ability to capture multiple frames and thus a block of
time. In terms of the UI, the profiler groups calls into batches, based on when the actual draw calls occur. This allows
the individual geometries being drawn to be tracked in a simple manner.
To see how redundant calls can negatively affect the performance of an application, sample code is included that
makes varying degrees of redundant calls. The number of objects being drawn can be modified, and these tools can
be used to determine how the application is making use of WebGL. From there on, other three-dimensional content
can be examined to see how different applications use the API.