Geoscience Reference
In-Depth Information
Tabl e 4. 1
Statistics of the stepwise consolidated crust-stripped gravity disturbances (as shown in
Fig.
4.1
)
Gravity disturbances
Min [mGal]
Max [mGal]
Mean [mGal]
STD [mGal]
ı
g
225
257
1
29
ı
g
T
647
156
72
107
ı
g
TB
511
636
260
233
ı
g
TBI
508
639
285
202
ı
g
TBIS
492
667
327
192
ı
g
cs
1,416
473
18
332
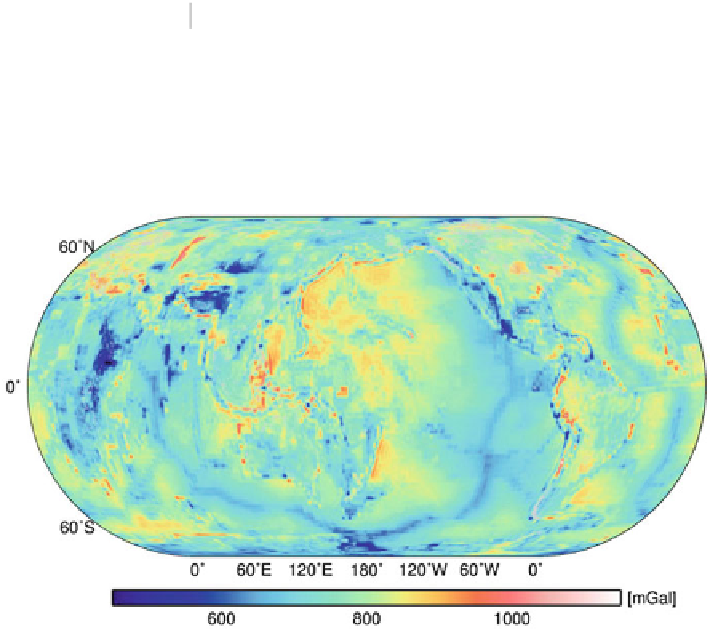
Fig. 4.2
The complete crust-stripped isostatic gravity disturbances computed globally on a 1
1
arc-deg surface grid
according to the expression in Eq. (
4.18
). The inverse solution was carried out
iteratively using a Gauss-Seidel scheme (e.g., Young
1971
). The regularization
was applied to stabilize the ill-posed solution. The gravimetric Moho solution is
shown in Fig.
4.3
. The Moho depths vary globally between 3.6 and 85.1 km, with
a mean of 13.6 km and a standard deviation of 13.4 km. The global map revealed a
typical pattern of the Moho geometry with the enhanced contrast between the thick
continental crust and thinner oceanic crust. The largest Moho depths were confirmed
under Andes and Himalayas with extension beneath the Tibetan Plateau, where the
maximum Moho depths exceed 70 km.


Search WWH ::

Custom Search