Geoscience Reference
In-Depth Information
10
5
0
Volga
Dnepr
−
5
−
10
−
15
YEARS
8
4
Ob
0
Yenisei
Lena
4
−
−
8
−
12
YEARS
15
10
Pechora
5
Dvina
0
Amur
−
5
−
10
−
15
YEARS
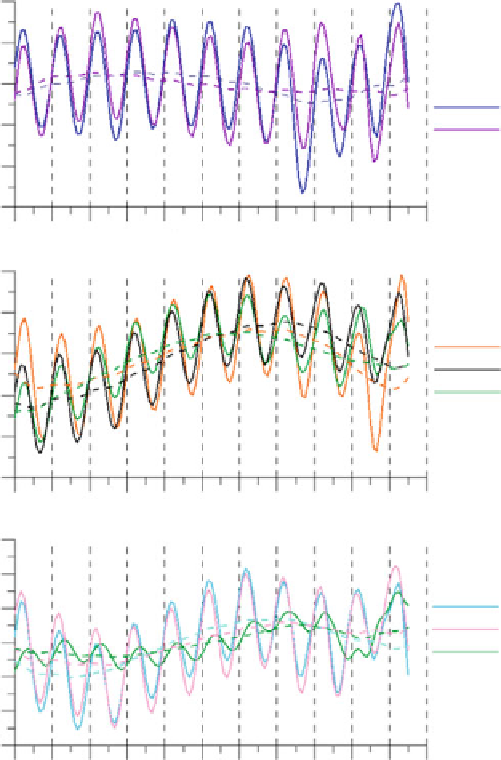
Fig. 3.6
Average mass changes captured by the sum of SNs 1-10 and trends (PC 2) for particular
river basins
observed by GRACE can be related mostly to the snow accumulation. According
to (Report on Climate
2013
), the amount of water stored in snow in winter 2012-
2013 was the largest in Russia since 1967. When snow melted in April-June, it
caused floods. Fortunately, the ground still had capacity to absorb water. That helped
to avoid extreme floods and state of emergency. Still, the occurrence of flood on
many rivers was less than 2 % (event happens once in 50 years); their water levels
increased in spring by several meters, which was detected by the river gauges.
We calculated the average plots for particular rivers of Siberia, European
part, Russian North, and the Far East (Fig.
3.6
). Our MSSA curves were found
Search WWH ::

Custom Search