Geoscience Reference
In-Depth Information
180˚
160˚
140˚
120˚
100˚
80˚
60˚
40˚
20˚
0˚
20˚
40˚
60˚
80˚ 100˚ 120˚ 140˚ 160˚ 180˚
−
−
−
−
−
−
−
−
−
80˚
80˚
60˚
60˚
40˚
40˚
20˚
20˚
0˚
0˚
−
20˚
−
20˚
40˚
−
40˚
−
−
60˚
−
60˚
−
80˚
−
80˚
−
180˚
−
160˚
−
140˚
−
120˚
−
100˚
−
80˚
−
60˚
−
40˚
−
20˚
0˚
20˚
40˚
60˚
80˚ 100˚ 120˚ 140˚ 160˚ 180˚
cm
−
60.0
−
40.0
−
20.0
0.0
20.0
40.0
60.0
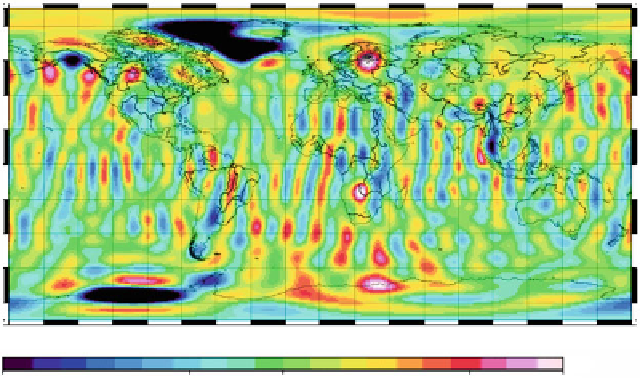
Fig. 3.1
Unfiltered GRACE EWH difference between 01.2003 and 01.2013 (2013-2003). Vertical
stripes distort the signal
Filtering methods based on principal component analysis (PCA), empirical
orthogonal functions (EOF), singular spectrum analysis (SSA), and independent
component analysis (ICA) were also proposed. PCA by the name of EOF analysis
was applied to the GRACE data in works by Rangelova et al. (
2007
), Schrama
et al. (
2007
), and Wouters and Schrama (
2007
). In Rangelova et al. (
2007
), SSA
was also tested. The rotation of PCA components to increase their meaningfulness
was recommended in Rangelova and Sideris (
2008
). In Han et al. (
2005
), non-
isotropic filtering was used. It is a kind of nonlinear modification of EOF analysis for
nonstationary time series, where PCs are obtained by means of time series envelope
calculation and orthogonalization. Good review of EOF-based methods of GRACE
data filtering can be found in Boergens et al. (
2014
). All these methods are quite
close to MSSA, but we find that MSSA is more flexible, despite its mathematical
complexity, and is thus preferred in this study. For the first time, we applied MSSA
for the filtering of GRACE observations in Zotov and Shum (
2009
). In Rangelova
et al. (
2010
), MSSA was also applied to regional GRACE data, but the length of
time series was yet too short to choose parameter L appropriately. Here we will
demonstrate the abilities of MSSA on GRACE data of 11-year extent. Multichannel
singular spectrum analysis, also called extended EOF, is a generalization of singular
spectrum analysis (SSA) for the multidimensional (multichannel) time series (Ghil
et al.
2002
; Jollife
2001
). SSA, in its turn, is based on PCA, generalized for
the time series in such way that instead of the simple correlation matrix, the
trajectory matrix is analyzed. It is obtained through the time series embedding
into the L-dimensional space. Parameter L is called lag or “caterpillar” length.
When L
D
1, SSA becomes PCA (trajectory matrix becomes non-lagged signal
Search WWH ::

Custom Search