Geoscience Reference
In-Depth Information
10
−1
H
2
O
CO
H
2
CH
4
10
0
10
1
10
2
10
3
10
4
10
5
10
−1
O
2
O
O
3
10
0
10
1
10
2
10
3
10
4
10
5
10
−14
10
−12
10
−10
10
−8
10
−6
10
−4
10
−2
10
0
Mixing Ratio
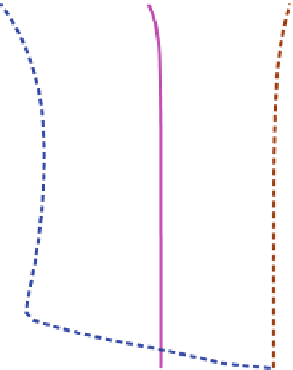
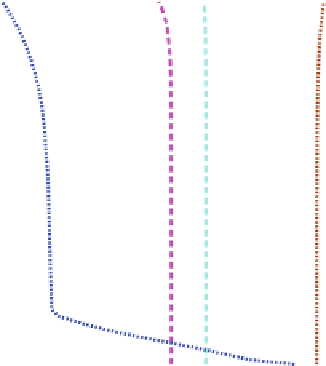
Fig. 12.4
Effects of the surface emission reducing gases on CO
2
-dominated atmospheres of rocky
exoplanets. The
upper panel
shows mixing ratios of H
2
O, CO, H
2
,andCH
4
,andthe
lower panel
shows mixing ratios of O
2
,O,andO
3
.The
solid lines
show the chemical composition of the
benchmark scenario. In particular the emission rate of H
2
is 3
10
10
cm
2
s
1
.The
dashed
lines
show the chemical composition of the same scenario, but with an H2 emission rate of
3
10
9
cm
2
s
1
,andthe
dotted lines
show the chemical composition for zero emission of
H
2
and CH
4
. A dramatic increase of O
2
and O
3
mixing ratios is caused by a decrease of the surface
emission of reduced gases (Reproduced from Hu et al.
2012
with the permission of the AAS)
reducing gases decreases. O
2
is virtually nonexistent at the surface for the Earth-
like emission rates of H
2
and CH
4
,butO
2
mixing ratio can be as high as 10
3
if
no H
2
or CH
4
is emitted (Fig.
12.4
). In particular, if no H
2
or CH
4
is emitted, the
O
3
column integrated number density can reach one third of the present-day Earth's


Search WWH ::

Custom Search