Geoscience Reference
In-Depth Information
HAT-P-10b
HAT-P-19b
-0.80
0.10
0.12
-0.78
0.14
-0.76
Observation
Model
0.16
Observation
Model
-0.74
56270.05
56270.10
56270.15
56270.20
56270.95
56271.00
56271.05
56271.10
BJD (2400000+)
BJD (2400000+)
1.14
WASP-43b
1.16
1.18
1.20
1.22
observation
Model
1.24
56250.36
56250.38
56250.40
56250.42
56250.44
BJD (2400000+)
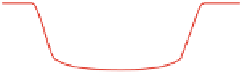
Fig. 11.5
The light curves of the observational transits and fitted models of the exoplanet systems
HAT-P-10b/WASP-11b, HAT-P-19b, and WASP-43b
11.5
Conclusions
The results from the analysis of our new data can be summarized as follows:
1. Using the JKTEBOP code, we analyzed new observational light curves of HAT-
P-10b/ WASP-11b, HAT-P-19b, and WASP-43b. The fractional radii (ra
C
rb),
the ratio of the radii, the orbital inclination, the new transit minima, our
transit depth, and transit width were obtained. The new orbital parameters (see
Tab les
11.1
and
11.2
) of these systems are in agreement with the previous results
(West et al.
2009
; Bakos et al.
2009
; Hellier et al.
2011
; Gillon et al.
2012
;etc).
2. The timing residuals giving a hint about a period change (see Fig.
11.5
), which
might be due to the presence of a second planet in the system or the sporadic
asymmetries of transit curves due to star spots on stellar surface result from
magnetic activity (Steffen and Agol
2005
; Lee et al.
2012
; etc). More photometric
data are needed to confirm that.


Search WWH ::

Custom Search