Geoscience Reference
In-Depth Information
0.01
0.008
0.006
0.004
0.002
0
0.01
0
-0.01
-0.02
-0.03
3931
3932
3933
3934
3935
3936
Wavelength (Å)
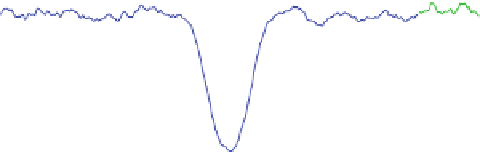
Fig. 11.2
To p
: the mean absolute deviation of the Ca II K core (
solid line
) of HD 179949. The
units are intensity as a fraction of the normalization level. Overlayed (
dashed line
) is the mean
spectrum (
scaled down
) indicating that the activity on HD 179949 is confined to the K emission.
Bottom
: residuals from the normalized mean spectrum of the Ca II K core of HD 179949 (With
permission from Shkolnik et al.
2003
)
HAT-P-20b, HAT-P-25b ::: (Bakos et al.
2006
), CoRoT project (Barge et al.
2008
),
XO project (MvVullough et al.
2005
), Kepler catalogue (Borucki et al.
2010
),
and other exoplanets HD 198733B (Knutson et al.
2007
), and Qatar-2b (Alsubai
et al.
2011
). The exoplanet transit database (
http://var2.astro.cz/ETD/
)
provided all
ever observed transits of transiting exoplanets to observers and researchers. We
could select most suitable observational objects from the internet (exoplanet transit
database) (Fig.
11.4
).
On the other hand, we will study chromospheric emission on the host star of
extraplanet system in several chromospheric activity indicators - Ca II H&K lines,
Na I D1 D2 lines, H alpha, H beta, and other Balmer lines, He I D3 lines, and Ca II
infrared triplet lines (especially Ca II H & K emission) induced by extrasolar planets


Search WWH ::

Custom Search