Geoscience Reference
In-Depth Information
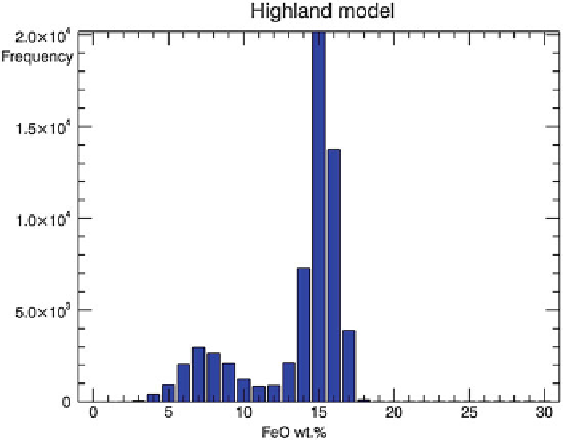
Fig. 1.7
Statistical result of iron abundance of the model build with highland spectra. The FeO
abundance peak of highland region is 7 wt%, which is lower than the first model (Fig.
1.6b
,9wt%)
as well as Lucey's result (Fig.
1.6a
,8wt%)
modeling with all the data presented in Table
1.1
(Fig.
1.6b
). From the statistical
results, we can find that the iron concentration peak of highland regions reduces to
7 wt% (Fig.
1.7
), as compared to the former 9 wt% (Fig.
1.5b
). Given the proportion
of highland data increases and PLS regression procedures remain the same, we can
conclude that the PLS model relies on the input modeling data, i.e., the spectral types
and iron abundances range of the modeling data could affect PLS model behavior
significantly. Although it looks like one can improve the PLS modeling behavior by
adding supplementary data to the original lunar sampling sites, the number of added
data should be in caution. As stated above, elemental abundance of added data is
usually calculated by empirical methods, which may induce uncertainty or even
correct conclusions. We have done tens of experiments with the number of data
points varying from dozens to hundreds; the PLS model presented in Sect.
1.4.1
is the best one when all the available Apollo and Luna ground truth data are
considered. As supplementary data for highlands and fresh areas, the added data
only accounts for a very small proportion in the modeling data compared to lunar
sampling stations. For future work, we will focus on trying to find more effective
variables or anticipating more typical sampling sites in the future missions.
Search WWH ::

Custom Search