Geoscience Reference
In-Depth Information
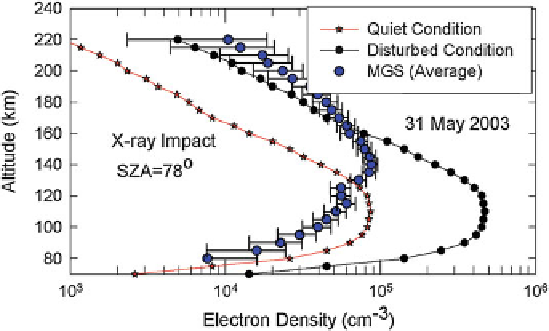
Fig. 7.17
Model calculation of electron densities at quiet (
red line
with
star
) and disturbed
conditions (
black line
with
circle
)forSZA78
ı
on 31 May 2003. Eight profiles were observed by
MGS on 31 May 2003. These profiles are averaged and plotted with error bars (
blue colour circle
)
in this figure for comparison with model calculations (Reproduced from Haider et al. (
2012
)by
permission of John Wiley & Sons Ltd.)
and EUV radiations, respectively, in this calculation only X-ray fluxes were used as
input, which produce the E region of the Martian ionosphere. Haider et al. (
2012
)
have reported that the modelled E layer peak height compares well with that of the
MGS observations during quiet condition. MGS did not measure electron density
during the maximum phase of the flare.
The Boltzmann equation is represented by continuity, momentum and energy
equations. The continuity equation is written as
@n
s
@t
Cr
.n
s
u
s
/
D
P
s
L
s
(7.1)
where
P
s
is the production rate of species
s
including primary production by
photoionisation and photoelectron impact ionisation (or by collisional ionisation by
energetic electrons or ions) as well as the production due to chemical reactions and
L
s
is the loss rate of species s due to chemistry of various reactions. This equation
has been used by many investigators to study the ionosphere of Mars (e.g. Fox et al.
1993
;Fox
2009
; Fox and Yeager
2006
,
2009
;Haideretal.
2010
and references
therein). The momentum equation for species
s
can be written as
n
s
m
s
h
@
u
s
@t
C
u
s
r
u
s
i
Dr
p
s
C
n
s
e
s
.
E C
u
s
B
/
C
n
s
m
s
g
n
s
m
s
X
j
v
sj
u
s
u
j
C
p
s
m
s
.
u
s
u
n
/ (7.2)
Search WWH ::

Custom Search