Geoscience Reference
In-Depth Information
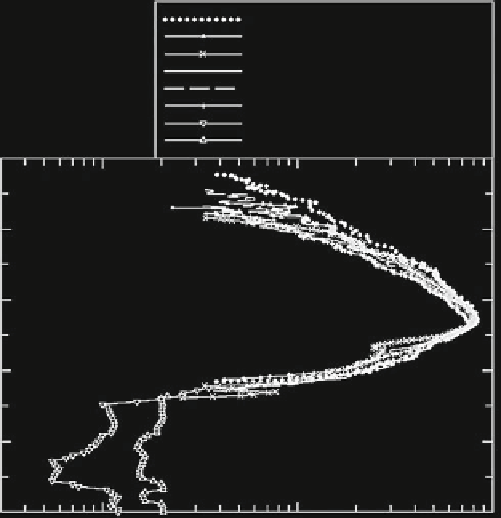
MGS(March 20,2005, 12.95 LT)
MGS(March 20,2005, 12.96 LT)
MGS(March 20,2005, 12.97 LT)
MGS(April 9,2005, 13.75 LT)
MGS(April 9,2005, 13.76 LT)
MGS(April 9,2005, 13.74 LT)
Mars 4(February 10,1974, 04.30 LT)
Mars 5(February 18,1974, 04.32 LT)
250
200
Mars' Ionosphere
150
100
50
0
10
3
10
4
10
5
Electron Density (cm
-3
)
Fig. 7.3
Six sample profile of electron density representing E and F layers in the Martian
ionosphere as observed by radio occultation experiment onboard MGS at nearly the same local
time in the afternoon. Density profiles representing D layer between altitude range
25-35 km is
observed by radio occultation experiment onboard Mars 4 and Mars 5 at 04:30 LST (Reproduced
from Haider et al. (
2009a
) by permission of John Wiley & Sons Ltd.)
7.2.3
Solar Wind Impact Ionisation
Outside the crustal magnetic field region, Mars has an induced magnetosphere.
As a result solar wind dynamic pressure compresses the interplanetary magnetic
field into the Martian ionosphere. Shinagawa and Cravens (
1989
) developed a
one-dimensional magnetohydrodynamic (MHD) model to study the role of electro-
magnetic forces in the Martian ionosphere. They found a good agreement between
model and Viking observations by adding an extra heat source caused by the solar
wind in the upper ionosphere. Later Shinagawa and Bougher (
1999
) developed a
two-dimensional MHD model and studied two cases of solar wind dynamic pressure
on Mars. In the first case, solar wind velocity was high
450 km/s, which exceeded
the maximum ionospheric pressure of Mars. In the second case, solar wind velocity
was below
300 km/s. This study showed that the upper ionosphere of Mars is
significantly influenced by solar wind. Using a three-dimensional model, Ma et al.
(
2004
) have reported that solar wind plays an important role above 250 km. Similar
Search WWH ::

Custom Search